TcfcFinance 532284 full analysis,charts,indicators,moving averages,SMA,DMA,EMA,ADX,MACD,RSITcfc Finance 532284 WideScreen charts, DMA,SMA,EMA technical analysis, forecast prediction, by indicators ADX,MACD,RSI,CCI BSE stock exchange
Daily price and charts and targets TcfcFinance Strong Daily Stock price targets for TcfcFinance 532284 are 44.29 and 49.99 | Daily Target 1 | 40.16 | | Daily Target 2 | 42.71 | | Daily Target 3 | 45.856666666667 | | Daily Target 4 | 48.41 | | Daily Target 5 | 51.56 |
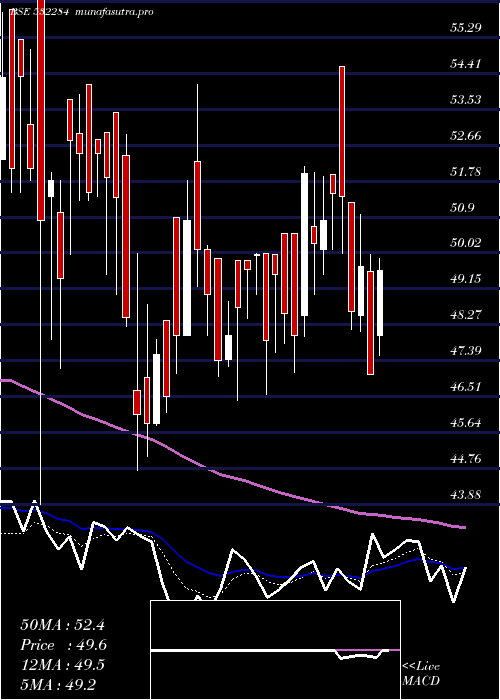
Daily price and volume Tcfc Finance
| Date |
Closing |
Open |
Range |
Volume |
Tue 21 October 2025 |
45.27 (-1.16%) |
44.16 |
43.30 - 49.00 |
0.5094 times |
Mon 20 October 2025 |
45.80 (3.57%) |
44.25 |
44.11 - 46.29 |
0.1357 times |
Fri 17 October 2025 |
44.22 (0.27%) |
43.35 |
43.35 - 45.64 |
1.5274 times |
Thu 16 October 2025 |
44.10 (1.31%) |
44.06 |
43.53 - 45.30 |
0.2251 times |
Wed 15 October 2025 |
43.53 (-1.05%) |
43.99 |
42.50 - 44.92 |
0.9149 times |
Tue 14 October 2025 |
43.99 (-1.37%) |
45.99 |
43.85 - 45.99 |
0.7697 times |
Mon 13 October 2025 |
44.60 (0.25%) |
45.00 |
44.52 - 45.86 |
0.6511 times |
Fri 10 October 2025 |
44.49 (1.21%) |
44.16 |
43.96 - 45.20 |
0.4579 times |
Thu 09 October 2025 |
43.96 (-3.81%) |
45.70 |
43.87 - 45.70 |
3.8502 times |
Wed 08 October 2025 |
45.70 (2.97%) |
45.80 |
43.40 - 45.80 |
0.9587 times |
Tue 07 October 2025 |
44.38 (-0.4%) |
43.75 |
43.75 - 45.74 |
0.5206 times |
Weekly price and charts TcfcFinance Strong weekly Stock price targets for TcfcFinance 532284 are 44.29 and 49.99 | Weekly Target 1 | 40.16 | | Weekly Target 2 | 42.71 | | Weekly Target 3 | 45.856666666667 | | Weekly Target 4 | 48.41 | | Weekly Target 5 | 51.56 |
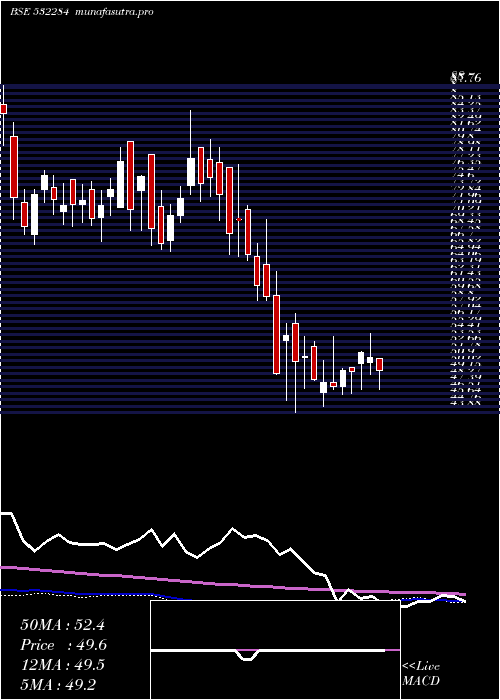
Weekly price and volumes for Tcfc Finance
| Date |
Closing |
Open |
Range |
Volume |
Tue 21 October 2025 |
45.27 (2.37%) |
44.25 |
43.30 - 49.00 |
0.1305 times |
Fri 17 October 2025 |
44.22 (-0.61%) |
45.00 |
42.50 - 45.99 |
0.8271 times |
Fri 10 October 2025 |
44.49 (-0.87%) |
44.30 |
43.40 - 45.80 |
1.3377 times |
Fri 03 October 2025 |
44.88 (0.65%) |
45.06 |
43.00 - 46.40 |
1.6688 times |
Fri 26 September 2025 |
44.59 (-2.34%) |
46.50 |
43.00 - 46.89 |
1.2616 times |
Fri 19 September 2025 |
45.66 (2.1%) |
44.62 |
44.62 - 47.89 |
1.2438 times |
Fri 12 September 2025 |
44.72 (-0.25%) |
44.66 |
43.35 - 47.09 |
0.6277 times |
Fri 05 September 2025 |
44.83 (-3.47%) |
45.16 |
44.00 - 46.99 |
1.4018 times |
Fri 29 August 2025 |
46.44 (0.8%) |
46.20 |
42.57 - 49.50 |
0.8589 times |
Fri 22 August 2025 |
46.07 (0.07%) |
46.04 |
45.00 - 49.80 |
0.6422 times |
Thu 14 August 2025 |
46.04 (-2.62%) |
47.28 |
42.30 - 47.74 |
1.0167 times |
Monthly price and charts TcfcFinance Strong monthly Stock price targets for TcfcFinance 532284 are 43.89 and 50.39 | Monthly Target 1 | 39.09 | | Monthly Target 2 | 42.18 | | Monthly Target 3 | 45.59 | | Monthly Target 4 | 48.68 | | Monthly Target 5 | 52.09 |
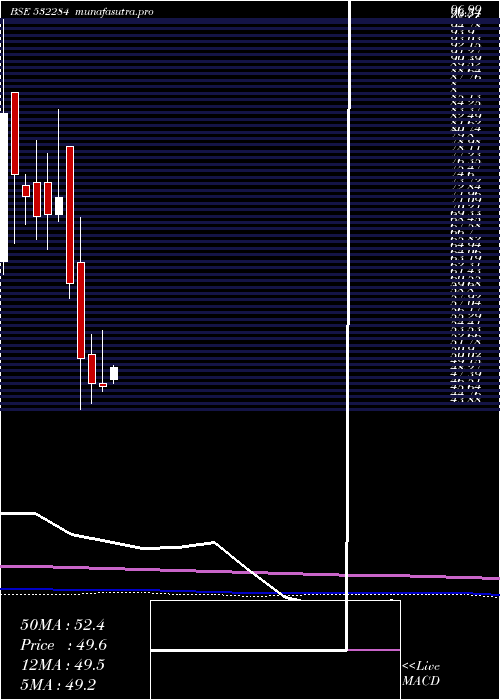
Monthly price and volumes Tcfc Finance
| Date |
Closing |
Open |
Range |
Volume |
Tue 21 October 2025 |
45.27 (1.53%) |
44.59 |
42.50 - 49.00 |
0.417 times |
Tue 30 September 2025 |
44.59 (-3.98%) |
45.16 |
43.00 - 47.89 |
0.6273 times |
Fri 29 August 2025 |
46.44 (-0.66%) |
47.64 |
42.30 - 49.80 |
0.4464 times |
Thu 31 July 2025 |
46.75 (1.48%) |
48.20 |
44.70 - 54.00 |
0.6621 times |
Mon 30 June 2025 |
46.07 (-1.37%) |
49.39 |
43.20 - 50.80 |
1.0083 times |
Fri 30 May 2025 |
46.71 (-0.74%) |
48.00 |
46.00 - 59.33 |
1.2018 times |
Wed 30 April 2025 |
47.06 (-0.72%) |
47.41 |
46.41 - 54.59 |
0.7085 times |
Fri 28 March 2025 |
47.40 (-6.73%) |
51.40 |
44.70 - 54.15 |
1.553 times |
Fri 28 February 2025 |
50.82 (-16.74%) |
63.92 |
43.88 - 69.95 |
1.8439 times |
Fri 31 January 2025 |
61.04 (-16%) |
79.70 |
59.00 - 79.70 |
1.5316 times |
Tue 31 December 2024 |
72.67 (3.15%) |
70.45 |
69.50 - 84.70 |
2.9257 times |
DMA SMA EMA moving averages of Tcfc Finance 532284
DMA (daily moving average) of Tcfc Finance 532284
| DMA period | DMA value | | 5 day DMA | 44.58 | | 12 day DMA | 44.55 | | 20 day DMA | 44.82 | | 35 day DMA | 45.09 | | 50 day DMA | 45.45 | | 100 day DMA | 46.04 | | 150 day DMA | 47.3 | | 200 day DMA | 51.09 | EMA (exponential moving average) of Tcfc Finance 532284
| EMA period | EMA current | EMA prev | EMA prev2 | | 5 day EMA | 44.89 | 44.7 | 44.15 | | 12 day EMA | 44.73 | 44.63 | 44.42 | | 20 day EMA | 44.84 | 44.8 | 44.69 | | 35 day EMA | 45.1 | 45.09 | 45.05 | | 50 day EMA | 45.41 | 45.42 | 45.4 |
SMA (simple moving average) of Tcfc Finance 532284
| SMA period | SMA current | SMA prev | SMA prev2 | | 5 day SMA | 44.58 | 44.33 | 44.09 | | 12 day SMA | 44.55 | 44.52 | 44.41 | | 20 day SMA | 44.82 | 44.81 | 44.81 | | 35 day SMA | 45.09 | 45.09 | 45.11 | | 50 day SMA | 45.45 | 45.46 | 45.47 | | 100 day SMA | 46.04 | 46.11 | 46.16 | | 150 day SMA | 47.3 | 47.35 | 47.37 | | 200 day SMA | 51.09 | 51.25 | 51.39 |
|
|
