TciIndus 532262 full analysis,charts,indicators,moving averages,SMA,DMA,EMA,ADX,MACD,RSITci Indus 532262 WideScreen charts, DMA,SMA,EMA technical analysis, forecast prediction, by indicators ADX,MACD,RSI,CCI BSE stock exchange
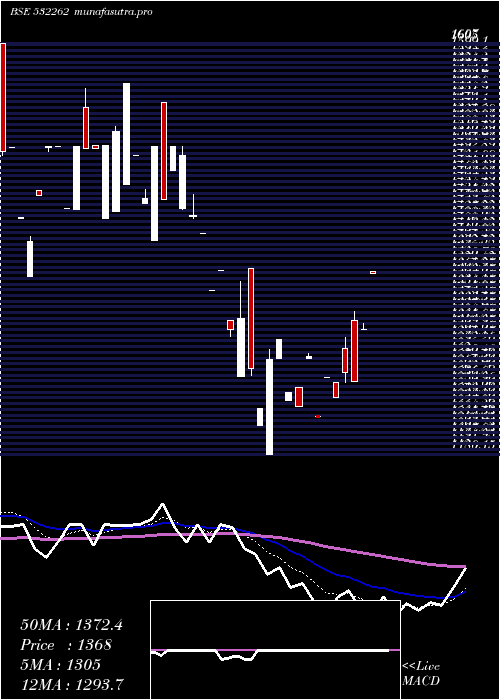
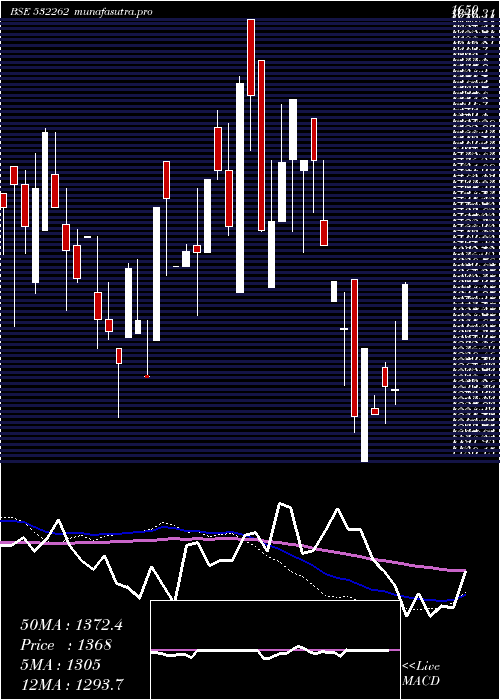
Daily price and charts and targets TciIndus Strong Daily Stock price targets for TciIndus 532262 are 1459.4 and 1578.2 | Daily Target 1 | 1360.4 | | Daily Target 2 | 1439.6 | | Daily Target 3 | 1479.2 | | Daily Target 4 | 1558.4 | | Daily Target 5 | 1598 |
Daily price and volume Tci Indus
| Date |
Closing |
Open |
Range |
Volume |
Fri 05 December 2025 |
1518.80 (4.38%) |
1400.00 |
1400.00 - 1518.80 |
0.0246 times |
Wed 03 December 2025 |
1455.00 (-0.07%) |
1401.80 |
1401.80 - 1455.00 |
0.0936 times |
Thu 27 November 2025 |
1456.00 (0.41%) |
1456.00 |
1456.00 - 1456.00 |
0.0012 times |
Wed 26 November 2025 |
1450.00 (0%) |
1450.00 |
1450.00 - 1450.00 |
0.0012 times |
Tue 25 November 2025 |
1450.00 (-1.02%) |
1465.00 |
1450.00 - 1510.00 |
4.6109 times |
Mon 24 November 2025 |
1465.00 (-2.33%) |
1435.00 |
1435.00 - 1465.00 |
4.1111 times |
Fri 21 November 2025 |
1500.00 (3.09%) |
1445.00 |
1435.00 - 1500.00 |
0.6365 times |
Thu 20 November 2025 |
1455.00 (-5.61%) |
1430.00 |
1430.00 - 1558.95 |
0.5036 times |
Tue 18 November 2025 |
1541.40 (3.11%) |
1541.40 |
1541.40 - 1541.40 |
0.0012 times |
Mon 17 November 2025 |
1494.95 (0%) |
1494.95 |
1494.95 - 1494.95 |
0.016 times |
Thu 13 November 2025 |
1494.95 (3.82%) |
1400.00 |
1400.00 - 1494.95 |
0.0037 times |
Weekly price and charts TciIndus Strong weekly Stock price targets for TciIndus 532262 are 1459.4 and 1578.2 | Weekly Target 1 | 1360.4 | | Weekly Target 2 | 1439.6 | | Weekly Target 3 | 1479.2 | | Weekly Target 4 | 1558.4 | | Weekly Target 5 | 1598 |
Weekly price and volumes for Tci Indus
| Date |
Closing |
Open |
Range |
Volume |
Fri 05 December 2025 |
1518.80 (4.31%) |
1401.80 |
1400.00 - 1518.80 |
0.1093 times |
Thu 27 November 2025 |
1456.00 (-2.93%) |
1435.00 |
1435.00 - 1510.00 |
8.0651 times |
Fri 21 November 2025 |
1500.00 (0.34%) |
1494.95 |
1430.00 - 1558.95 |
1.0699 times |
Thu 13 November 2025 |
1494.95 (4.2%) |
1434.65 |
1400.00 - 1494.95 |
0.1298 times |
Fri 07 November 2025 |
1434.65 (-1.4%) |
1450.00 |
1340.05 - 1450.00 |
0.2003 times |
Fri 31 October 2025 |
1455.00 (4.6%) |
1460.00 |
1454.95 - 1460.00 |
0.0239 times |
Thu 23 October 2025 |
1391.05 (-4.22%) |
1452.35 |
1391.05 - 1484.80 |
0.0626 times |
Wed 08 October 2025 |
1452.35 (-4.76%) |
1456.35 |
1448.75 - 1516.95 |
0.3016 times |
Fri 03 October 2025 |
1524.95 (3.25%) |
1531.00 |
1455.05 - 1531.00 |
0.0239 times |
Wed 24 September 2025 |
1476.95 (10.55%) |
1389.95 |
1388.05 - 1476.95 |
0.0137 times |
Fri 19 September 2025 |
1336.00 (-6.57%) |
1401.00 |
1325.00 - 1463.15 |
0.0637 times |
Monthly price and charts TciIndus Strong monthly Stock price targets for TciIndus 532262 are 1459.4 and 1578.2 | Monthly Target 1 | 1360.4 | | Monthly Target 2 | 1439.6 | | Monthly Target 3 | 1479.2 | | Monthly Target 4 | 1558.4 | | Monthly Target 5 | 1598 |
Monthly price and volumes Tci Indus
| Date |
Closing |
Open |
Range |
Volume |
Fri 05 December 2025 |
1518.80 (4.31%) |
1401.80 |
1400.00 - 1518.80 |
0.0404 times |
Thu 27 November 2025 |
1456.00 (0.07%) |
1450.00 |
1340.05 - 1558.95 |
3.5038 times |
Fri 31 October 2025 |
1455.00 (-4.96%) |
1455.05 |
1391.05 - 1524.95 |
0.1483 times |
Mon 29 September 2025 |
1530.95 (11.29%) |
1418.00 |
1315.05 - 1540.00 |
0.3577 times |
Thu 28 August 2025 |
1375.65 (-1.74%) |
1337.00 |
1300.00 - 1450.00 |
0.7066 times |
Wed 30 July 2025 |
1400.00 (16.66%) |
1200.05 |
1188.00 - 1558.95 |
1.6023 times |
Mon 30 June 2025 |
1200.05 (-2.04%) |
1190.00 |
1182.00 - 1290.00 |
0.2625 times |
Thu 29 May 2025 |
1225.00 (-10.45%) |
1300.00 |
1200.00 - 1300.00 |
0.9644 times |
Tue 22 April 2025 |
1368.00 (11.22%) |
1280.00 |
1220.00 - 1370.00 |
0.1079 times |
Fri 28 March 2025 |
1230.00 (-10.28%) |
1320.00 |
1180.15 - 1373.00 |
2.306 times |
Fri 28 February 2025 |
1371.00 (-12.4%) |
1490.00 |
1350.05 - 1545.00 |
0.734 times |
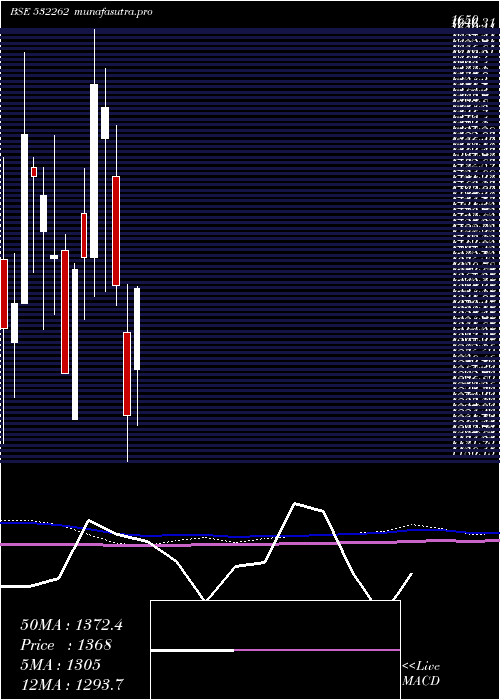
DMA SMA EMA moving averages of Tci Indus 532262
DMA (daily moving average) of Tci Indus 532262
| DMA period | DMA value | | 5 day DMA | 1465.96 | | 12 day DMA | 1476.76 | | 20 day DMA | 1457.69 | | 35 day DMA | 1451.33 | | 50 day DMA | 1430.41 | | 100 day DMA | 1356.89 | | 150 day DMA | 1389.49 | | 200 day DMA | 1388.04 | EMA (exponential moving average) of Tci Indus 532262
| EMA period | EMA current | EMA prev | EMA prev2 | | 5 day EMA | 1478.8 | 1458.8 | 1460.7 | | 12 day EMA | 1470.3 | 1461.48 | 1462.66 | | 20 day EMA | 1462.74 | 1456.84 | 1457.03 | | 35 day EMA | 1444.67 | 1440.31 | 1439.44 | | 50 day EMA | 1428.44 | 1424.75 | 1423.52 |
SMA (simple moving average) of Tci Indus 532262
| SMA period | SMA current | SMA prev | SMA prev2 | | 5 day SMA | 1465.96 | 1455.2 | 1464.2 | | 12 day SMA | 1476.76 | 1469.75 | 1468.05 | | 20 day SMA | 1457.69 | 1454.37 | 1457.33 | | 35 day SMA | 1451.33 | 1448.22 | 1446.93 | | 50 day SMA | 1430.41 | 1427.63 | 1425.23 | | 100 day SMA | 1356.89 | 1354.15 | 1352.6 | | 150 day SMA | 1389.49 | 1389.06 | 1388.7 | | 200 day SMA | 1388.04 | 1387.88 | 1388.25 |
|
|
