NatAlum 532234 full analysis,charts,indicators,moving averages,SMA,DMA,EMA,ADX,MACD,RSINat Alum 532234 WideScreen charts, DMA,SMA,EMA technical analysis, forecast prediction, by indicators ADX,MACD,RSI,CCI BSE stock exchange
Daily price and charts and targets NatAlum Strong Daily Stock price targets for NatAlum 532234 are 269.88 and 277.68 | Daily Target 1 | 263.57 | | Daily Target 2 | 268.38 | | Daily Target 3 | 271.36666666667 | | Daily Target 4 | 276.18 | | Daily Target 5 | 279.17 |
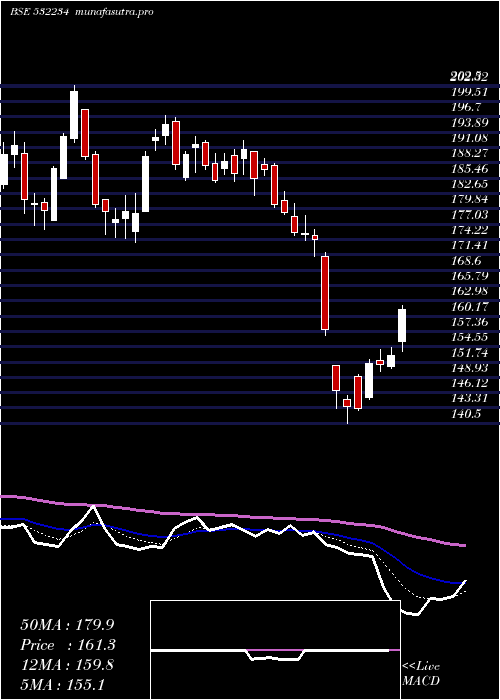
Daily price and volume Nat Alum
| Date |
Closing |
Open |
Range |
Volume |
Fri 05 December 2025 |
273.20 (1.45%) |
269.30 |
266.55 - 274.35 |
1.5833 times |
Thu 04 December 2025 |
269.30 (1.07%) |
267.80 |
267.55 - 270.35 |
0.5697 times |
Wed 03 December 2025 |
266.45 (0.55%) |
265.20 |
262.00 - 268.00 |
0.7216 times |
Tue 02 December 2025 |
265.00 (0.45%) |
265.20 |
264.05 - 268.15 |
1.005 times |
Mon 01 December 2025 |
263.80 (1.46%) |
262.00 |
262.00 - 267.50 |
2.9919 times |
Fri 28 November 2025 |
260.00 (-0.5%) |
262.95 |
259.55 - 264.50 |
0.4512 times |
Thu 27 November 2025 |
261.30 (1.22%) |
259.30 |
259.30 - 265.55 |
0.8617 times |
Wed 26 November 2025 |
258.15 (1.65%) |
255.20 |
255.20 - 259.40 |
0.5099 times |
Tue 25 November 2025 |
253.95 (1.22%) |
250.50 |
250.50 - 255.70 |
0.5155 times |
Mon 24 November 2025 |
250.90 (0.22%) |
250.10 |
249.40 - 254.10 |
0.79 times |
Fri 21 November 2025 |
250.35 (-2.89%) |
255.80 |
249.90 - 256.05 |
0.7737 times |
Weekly price and charts NatAlum Strong weekly Stock price targets for NatAlum 532234 are 267.6 and 279.95 | Weekly Target 1 | 257.5 | | Weekly Target 2 | 265.35 | | Weekly Target 3 | 269.85 | | Weekly Target 4 | 277.7 | | Weekly Target 5 | 282.2 |
Weekly price and volumes for Nat Alum
| Date |
Closing |
Open |
Range |
Volume |
Fri 05 December 2025 |
273.20 (5.08%) |
262.00 |
262.00 - 274.35 |
0.9657 times |
Fri 28 November 2025 |
260.00 (3.85%) |
250.10 |
249.40 - 265.55 |
0.4396 times |
Fri 21 November 2025 |
250.35 (-4.57%) |
263.00 |
249.90 - 264.05 |
0.64 times |
Fri 14 November 2025 |
262.35 (11.9%) |
240.10 |
240.10 - 272.00 |
2.2337 times |
Fri 07 November 2025 |
234.45 (0.15%) |
237.00 |
227.55 - 240.10 |
0.3524 times |
Fri 31 October 2025 |
234.10 (2.56%) |
237.05 |
233.20 - 241.00 |
0.6523 times |
Thu 23 October 2025 |
228.25 (1.26%) |
225.40 |
222.60 - 231.10 |
0.3865 times |
Fri 17 October 2025 |
225.40 (0.54%) |
223.75 |
222.00 - 230.65 |
0.4302 times |
Fri 10 October 2025 |
224.20 (1.38%) |
221.80 |
216.00 - 232.25 |
2.6656 times |
Fri 03 October 2025 |
221.15 (10.3%) |
200.65 |
200.65 - 224.50 |
1.234 times |
Fri 26 September 2025 |
200.50 (-5.27%) |
211.25 |
198.80 - 214.40 |
0.5795 times |

Monthly price and charts NatAlum Strong monthly Stock price targets for NatAlum 532234 are 267.6 and 279.95 | Monthly Target 1 | 257.5 | | Monthly Target 2 | 265.35 | | Monthly Target 3 | 269.85 | | Monthly Target 4 | 277.7 | | Monthly Target 5 | 282.2 |
Monthly price and volumes Nat Alum
| Date |
Closing |
Open |
Range |
Volume |
Fri 05 December 2025 |
273.20 (5.08%) |
262.00 |
262.00 - 274.35 |
0.3044 times |
Fri 28 November 2025 |
260.00 (11.06%) |
237.00 |
227.55 - 272.00 |
1.1556 times |
Fri 31 October 2025 |
234.10 (9.42%) |
214.95 |
210.30 - 241.00 |
1.538 times |
Tue 30 September 2025 |
213.95 (14.9%) |
186.25 |
186.25 - 221.20 |
1.2191 times |
Fri 29 August 2025 |
186.20 (0.54%) |
184.00 |
180.10 - 193.50 |
0.5577 times |
Thu 31 July 2025 |
185.20 (-3.87%) |
193.50 |
184.20 - 200.00 |
0.6765 times |
Mon 30 June 2025 |
192.65 (6.79%) |
178.20 |
176.40 - 197.60 |
1.4337 times |
Fri 30 May 2025 |
180.40 (15.49%) |
157.25 |
149.00 - 191.65 |
1.3708 times |
Wed 30 April 2025 |
156.20 (-11.02%) |
175.10 |
140.50 - 178.65 |
1.1643 times |
Fri 28 March 2025 |
175.55 (-1.29%) |
178.00 |
173.60 - 197.00 |
0.58 times |
Fri 28 February 2025 |
177.85 (-12.04%) |
194.95 |
174.50 - 203.85 |
0.7908 times |

DMA SMA EMA moving averages of Nat Alum 532234
DMA (daily moving average) of Nat Alum 532234
| DMA period | DMA value | | 5 day DMA | 267.55 | | 12 day DMA | 260.85 | | 20 day DMA | 260.17 | | 35 day DMA | 247.86 | | 50 day DMA | 237.95 | | 100 day DMA | 216.72 | | 150 day DMA | 204.62 | | 200 day DMA | 198.19 | EMA (exponential moving average) of Nat Alum 532234
| EMA period | EMA current | EMA prev | EMA prev2 | | 5 day EMA | 267.94 | 265.31 | 263.32 | | 12 day EMA | 262.87 | 260.99 | 259.48 | | 20 day EMA | 257.91 | 256.3 | 254.93 | | 35 day EMA | 248.84 | 247.41 | 246.12 | | 50 day EMA | 238.99 | 237.59 | 236.3 |
SMA (simple moving average) of Nat Alum 532234
| SMA period | SMA current | SMA prev | SMA prev2 | | 5 day SMA | 267.55 | 264.91 | 263.31 | | 12 day SMA | 260.85 | 259.53 | 258.8 | | 20 day SMA | 260.17 | 258.04 | 256.24 | | 35 day SMA | 247.86 | 246.49 | 245.2 | | 50 day SMA | 237.95 | 236.72 | 235.61 | | 100 day SMA | 216.72 | 215.85 | 215.06 | | 150 day SMA | 204.62 | 203.86 | 203.11 | | 200 day SMA | 198.19 | 197.77 | 197.43 |
|
|
