BengalTea 532230 full analysis,charts,indicators,moving averages,SMA,DMA,EMA,ADX,MACD,RSIBengal Tea 532230 WideScreen charts, DMA,SMA,EMA technical analysis, forecast prediction, by indicators ADX,MACD,RSI,CCI BSE stock exchange
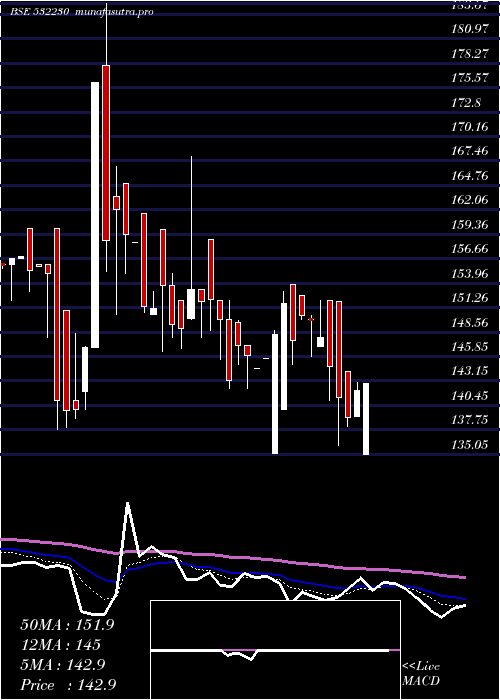
Daily price and charts and targets BengalTea Strong Daily Stock price targets for BengalTea 532230 are 138.5 and 139.5 | Daily Target 1 | 138.33 | | Daily Target 2 | 138.67 | | Daily Target 3 | 139.33333333333 | | Daily Target 4 | 139.67 | | Daily Target 5 | 140.33 |
Daily price and volume Bengal Tea
| Date |
Closing |
Open |
Range |
Volume |
Fri 05 December 2025 |
139.00 (1.46%) |
140.00 |
139.00 - 140.00 |
0.279 times |
Thu 04 December 2025 |
137.00 (0%) |
137.00 |
137.00 - 140.00 |
0.2861 times |
Wed 03 December 2025 |
137.00 (0%) |
137.00 |
137.00 - 140.00 |
1.7517 times |
Tue 02 December 2025 |
137.00 (0%) |
137.00 |
135.00 - 138.50 |
0.362 times |
Mon 01 December 2025 |
137.00 (0%) |
136.60 |
136.60 - 137.00 |
0.0671 times |
Fri 28 November 2025 |
137.00 (-1.23%) |
138.05 |
137.00 - 138.05 |
0.0547 times |
Thu 27 November 2025 |
138.70 (1.24%) |
137.00 |
134.20 - 140.25 |
6.4418 times |
Wed 26 November 2025 |
137.00 (1.48%) |
135.50 |
135.00 - 137.00 |
0.1095 times |
Tue 25 November 2025 |
135.00 (-1.5%) |
129.00 |
129.00 - 138.00 |
0.2984 times |
Mon 24 November 2025 |
137.05 (0.07%) |
138.30 |
135.00 - 138.80 |
0.3496 times |
Fri 21 November 2025 |
136.95 (1.18%) |
137.00 |
135.35 - 138.00 |
0.219 times |
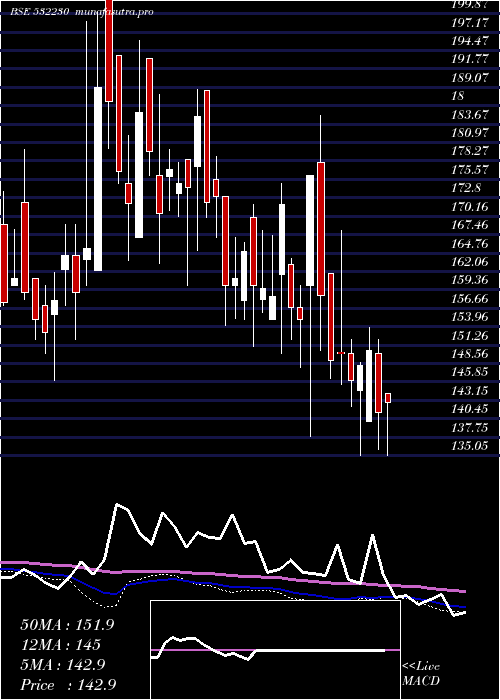
Weekly price and charts BengalTea Strong weekly Stock price targets for BengalTea 532230 are 137 and 142 | Weekly Target 1 | 133 | | Weekly Target 2 | 136 | | Weekly Target 3 | 138 | | Weekly Target 4 | 141 | | Weekly Target 5 | 143 |
Weekly price and volumes for Bengal Tea
| Date |
Closing |
Open |
Range |
Volume |
Fri 05 December 2025 |
139.00 (1.46%) |
136.60 |
135.00 - 140.00 |
0.3832 times |
Fri 28 November 2025 |
137.00 (0.04%) |
138.30 |
129.00 - 140.25 |
1.0123 times |
Fri 21 November 2025 |
136.95 (0.55%) |
135.05 |
131.00 - 139.95 |
0.4497 times |
Fri 14 November 2025 |
136.20 (0.15%) |
135.05 |
134.00 - 150.95 |
1.8484 times |
Fri 07 November 2025 |
136.00 (2.72%) |
136.70 |
130.20 - 138.80 |
0.7314 times |
Fri 31 October 2025 |
132.40 (-4.75%) |
134.00 |
130.10 - 137.95 |
0.6742 times |
Thu 23 October 2025 |
139.00 (0.22%) |
146.40 |
131.60 - 146.40 |
0.3371 times |
Fri 17 October 2025 |
138.70 (2.74%) |
134.00 |
131.00 - 147.80 |
1.4157 times |
Fri 10 October 2025 |
135.00 (-3.02%) |
135.15 |
128.10 - 140.40 |
2.8003 times |
Fri 03 October 2025 |
139.20 (2.58%) |
139.50 |
135.75 - 140.00 |
0.3477 times |
Fri 26 September 2025 |
135.70 (-4.6%) |
144.00 |
135.70 - 144.00 |
0.3452 times |
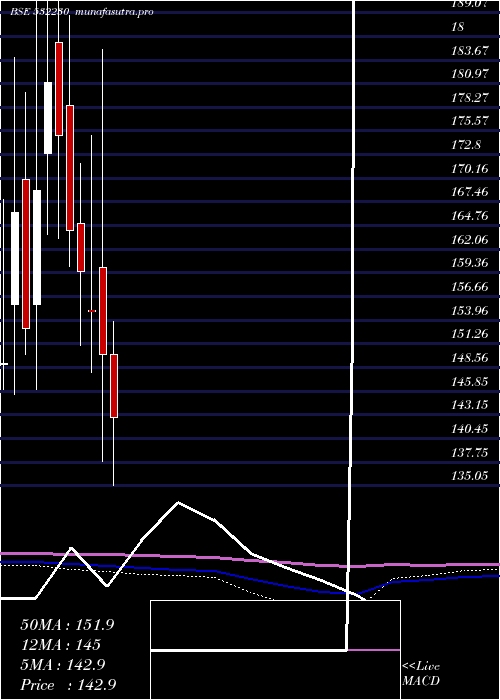
Monthly price and charts BengalTea Strong monthly Stock price targets for BengalTea 532230 are 137 and 142 | Monthly Target 1 | 133 | | Monthly Target 2 | 136 | | Monthly Target 3 | 138 | | Monthly Target 4 | 141 | | Monthly Target 5 | 143 |
Monthly price and volumes Bengal Tea
| Date |
Closing |
Open |
Range |
Volume |
Fri 05 December 2025 |
139.00 (1.46%) |
136.60 |
135.00 - 140.00 |
0.0761 times |
Fri 28 November 2025 |
137.00 (3.47%) |
136.70 |
129.00 - 150.95 |
0.8023 times |
Fri 31 October 2025 |
132.40 (-5.39%) |
136.10 |
128.10 - 147.80 |
1.0696 times |
Tue 30 September 2025 |
139.95 (3.67%) |
132.05 |
126.50 - 144.00 |
0.4297 times |
Fri 29 August 2025 |
135.00 (0.41%) |
134.45 |
126.90 - 144.75 |
0.7688 times |
Thu 31 July 2025 |
134.45 (-9.16%) |
146.50 |
131.25 - 149.90 |
0.9317 times |
Mon 30 June 2025 |
148.00 (-5.67%) |
160.00 |
138.05 - 167.00 |
0.7237 times |
Fri 30 May 2025 |
156.90 (9.84%) |
140.00 |
127.00 - 168.00 |
0.3371 times |
Wed 30 April 2025 |
142.85 (-4.77%) |
150.00 |
135.05 - 153.80 |
0.2686 times |
Fri 28 March 2025 |
150.00 (-3.23%) |
160.00 |
137.85 - 184.90 |
4.5925 times |
Fri 28 February 2025 |
155.00 (-2.82%) |
155.05 |
148.00 - 175.00 |
0.3917 times |
DMA SMA EMA moving averages of Bengal Tea 532230
DMA (daily moving average) of Bengal Tea 532230
| DMA period | DMA value | | 5 day DMA | 137.4 | | 12 day DMA | 137 | | 20 day DMA | 136.5 | | 35 day DMA | 136.26 | | 50 day DMA | 136.38 | | 100 day DMA | 137.12 | | 150 day DMA | 139.41 | | 200 day DMA | 143.22 | EMA (exponential moving average) of Bengal Tea 532230
| EMA period | EMA current | EMA prev | EMA prev2 | | 5 day EMA | 137.67 | 137.01 | 137.01 | | 12 day EMA | 137.07 | 136.72 | 136.67 | | 20 day EMA | 136.74 | 136.5 | 136.45 | | 35 day EMA | 136.74 | 136.61 | 136.59 | | 50 day EMA | 136.74 | 136.65 | 136.64 |
SMA (simple moving average) of Bengal Tea 532230
| SMA period | SMA current | SMA prev | SMA prev2 | | 5 day SMA | 137.4 | 137 | 137.34 | | 12 day SMA | 137 | 136.67 | 136.62 | | 20 day SMA | 136.5 | 136.31 | 136.09 | | 35 day SMA | 136.26 | 136.14 | 136.09 | | 50 day SMA | 136.38 | 136.45 | 136.48 | | 100 day SMA | 137.12 | 137.18 | 137.24 | | 150 day SMA | 139.41 | 139.47 | 139.56 | | 200 day SMA | 143.22 | 143.32 | 143.42 |
|
|
