AxisBank 532215 full analysis,charts,indicators,moving averages,SMA,DMA,EMA,ADX,MACD,RSIAxis Bank 532215 WideScreen charts, DMA,SMA,EMA technical analysis, forecast prediction, by indicators ADX,MACD,RSI,CCI BSE stock exchange
Daily price and charts and targets AxisBank Strong Daily Stock price targets for AxisBank 532215 are 1250.73 and 1284.38 | Daily Target 1 | 1225.4 | | Daily Target 2 | 1242.4 | | Daily Target 3 | 1259.05 | | Daily Target 4 | 1276.05 | | Daily Target 5 | 1292.7 |
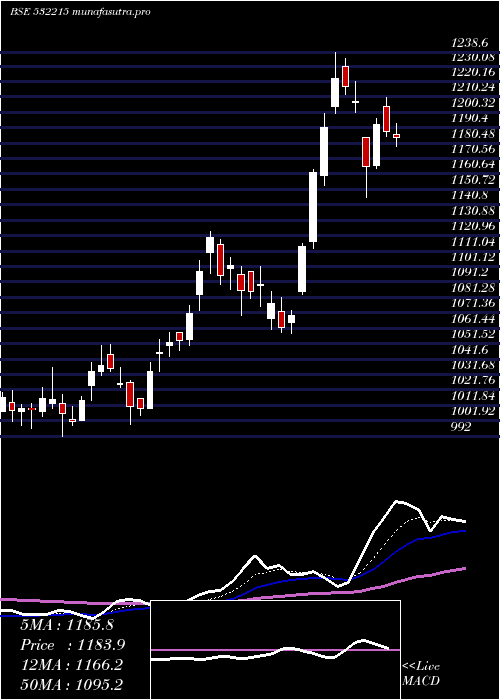
Daily price and volume Axis Bank
| Date |
Closing |
Open |
Range |
Volume |
Thu 23 October 2025 |
1259.40 (1.9%) |
1245.40 |
1242.05 - 1275.70 |
1.9701 times |
Tue 21 October 2025 |
1235.90 (0.8%) |
1223.20 |
1223.00 - 1238.40 |
0.495 times |
Mon 20 October 2025 |
1226.15 (2.17%) |
1205.15 |
1205.15 - 1231.55 |
0.4103 times |
Fri 17 October 2025 |
1200.15 (0.33%) |
1199.80 |
1191.45 - 1212.90 |
0.6426 times |
Thu 16 October 2025 |
1196.25 (2.33%) |
1211.00 |
1185.50 - 1217.65 |
3.5498 times |
Wed 15 October 2025 |
1169.00 (-0.65%) |
1183.65 |
1164.05 - 1183.65 |
0.8077 times |
Tue 14 October 2025 |
1176.60 (-1.08%) |
1193.95 |
1166.70 - 1193.95 |
0.2384 times |
Mon 13 October 2025 |
1189.45 (0.79%) |
1173.95 |
1167.50 - 1193.50 |
0.2625 times |
Fri 10 October 2025 |
1180.10 (1.08%) |
1167.45 |
1165.05 - 1191.75 |
0.4559 times |
Thu 09 October 2025 |
1167.45 (-1.1%) |
1180.40 |
1162.90 - 1187.00 |
1.1676 times |
Wed 08 October 2025 |
1180.40 (-0.53%) |
1184.70 |
1174.30 - 1193.95 |
0.7474 times |
Weekly price and charts AxisBank Strong weekly Stock price targets for AxisBank 532215 are 1232.28 and 1302.83 | Weekly Target 1 | 1176.2 | | Weekly Target 2 | 1217.8 | | Weekly Target 3 | 1246.75 | | Weekly Target 4 | 1288.35 | | Weekly Target 5 | 1317.3 |
Weekly price and volumes for Axis Bank
| Date |
Closing |
Open |
Range |
Volume |
Thu 23 October 2025 |
1259.40 (4.94%) |
1205.15 |
1205.15 - 1275.70 |
0.7387 times |
Fri 17 October 2025 |
1200.15 (1.7%) |
1173.95 |
1164.05 - 1217.65 |
1.4133 times |
Fri 10 October 2025 |
1180.10 (-0.14%) |
1175.75 |
1162.90 - 1215.00 |
1.7565 times |
Fri 03 October 2025 |
1181.70 (2.42%) |
1154.00 |
1125.50 - 1187.70 |
0.6151 times |
Fri 26 September 2025 |
1153.75 (1.57%) |
1130.30 |
1130.30 - 1172.85 |
1.1029 times |
Fri 19 September 2025 |
1135.95 (2.77%) |
1106.00 |
1100.25 - 1143.90 |
0.656 times |
Fri 12 September 2025 |
1105.30 (4.65%) |
1053.35 |
1048.70 - 1108.30 |
0.4453 times |
Fri 05 September 2025 |
1056.20 (1.02%) |
1041.30 |
1041.30 - 1065.00 |
0.4149 times |
Fri 29 August 2025 |
1045.55 (-2.32%) |
1071.20 |
1042.50 - 1074.35 |
1.401 times |
Fri 22 August 2025 |
1070.40 (0.27%) |
1077.30 |
1069.35 - 1094.95 |
1.4563 times |
Thu 14 August 2025 |
1067.50 (0.96%) |
1060.00 |
1053.00 - 1076.45 |
0.184 times |

Monthly price and charts AxisBank Strong monthly Stock price targets for AxisBank 532215 are 1195.63 and 1339.48 | Monthly Target 1 | 1078.47 | | Monthly Target 2 | 1168.93 | | Monthly Target 3 | 1222.3166666667 | | Monthly Target 4 | 1312.78 | | Monthly Target 5 | 1366.17 |
Monthly price and volumes Axis Bank
| Date |
Closing |
Open |
Range |
Volume |
Thu 23 October 2025 |
1259.40 (11.27%) |
1133.05 |
1131.85 - 1275.70 |
0.7666 times |
Tue 30 September 2025 |
1131.85 (8.25%) |
1041.30 |
1041.30 - 1172.85 |
0.4791 times |
Fri 29 August 2025 |
1045.55 (-2.13%) |
1060.25 |
1042.50 - 1094.95 |
1.6701 times |
Thu 31 July 2025 |
1068.30 (-10.9%) |
1200.20 |
1055.30 - 1202.90 |
0.8725 times |
Mon 30 June 2025 |
1199.00 (0.58%) |
1197.75 |
1152.00 - 1247.00 |
0.8282 times |
Fri 30 May 2025 |
1192.05 (0.69%) |
1184.95 |
1148.50 - 1224.10 |
0.6279 times |
Wed 30 April 2025 |
1183.90 (7.44%) |
1095.95 |
1057.80 - 1238.60 |
0.5912 times |
Fri 28 March 2025 |
1101.90 (8.47%) |
1013.20 |
992.00 - 1123.40 |
0.3519 times |
Fri 28 February 2025 |
1015.85 (2.99%) |
989.70 |
978.00 - 1035.90 |
0.8157 times |
Fri 31 January 2025 |
986.40 (-7.4%) |
1066.95 |
934.00 - 1094.55 |
2.9968 times |
Tue 31 December 2024 |
1065.25 (-6.29%) |
1133.00 |
1058.95 - 1193.65 |
0.5853 times |

DMA SMA EMA moving averages of Axis Bank 532215
DMA (daily moving average) of Axis Bank 532215
| DMA period | DMA value | | 5 day DMA | 1223.57 | | 12 day DMA | 1197.3 | | 20 day DMA | 1183.16 | | 35 day DMA | 1146.57 | | 50 day DMA | 1122.74 | | 100 day DMA | 1139.89 | | 150 day DMA | 1139.36 | | 200 day DMA | 1109.17 | EMA (exponential moving average) of Axis Bank 532215
| EMA period | EMA current | EMA prev | EMA prev2 | | 5 day EMA | 1228.29 | 1212.73 | 1201.14 | | 12 day EMA | 1203.61 | 1193.47 | 1185.76 | | 20 day EMA | 1185.02 | 1177.19 | 1171.01 | | 35 day EMA | 1156.17 | 1150.09 | 1145.04 | | 50 day EMA | 1128.58 | 1123.24 | 1118.64 |
SMA (simple moving average) of Axis Bank 532215
| SMA period | SMA current | SMA prev | SMA prev2 | | 5 day SMA | 1223.57 | 1205.49 | 1193.63 | | 12 day SMA | 1197.3 | 1193.39 | 1188.87 | | 20 day SMA | 1183.16 | 1178.73 | 1174.15 | | 35 day SMA | 1146.57 | 1140.75 | 1135.77 | | 50 day SMA | 1122.74 | 1118.7 | 1115.52 | | 100 day SMA | 1139.89 | 1139.31 | 1138.9 | | 150 day SMA | 1139.36 | 1137.86 | 1136.39 | | 200 day SMA | 1109.17 | 1108.27 | 1107.49 |
|
|
