IndiaTouris 532189 full analysis,charts,indicators,moving averages,SMA,DMA,EMA,ADX,MACD,RSIIndia Touris 532189 WideScreen charts, DMA,SMA,EMA technical analysis, forecast prediction, by indicators ADX,MACD,RSI,CCI BSE stock exchange
Daily price and charts and targets IndiaTouris Strong Daily Stock price targets for IndiaTouris 532189 are 612.6 and 623.9 | Daily Target 1 | 604.22 | | Daily Target 2 | 609.68 | | Daily Target 3 | 615.51666666667 | | Daily Target 4 | 620.98 | | Daily Target 5 | 626.82 |
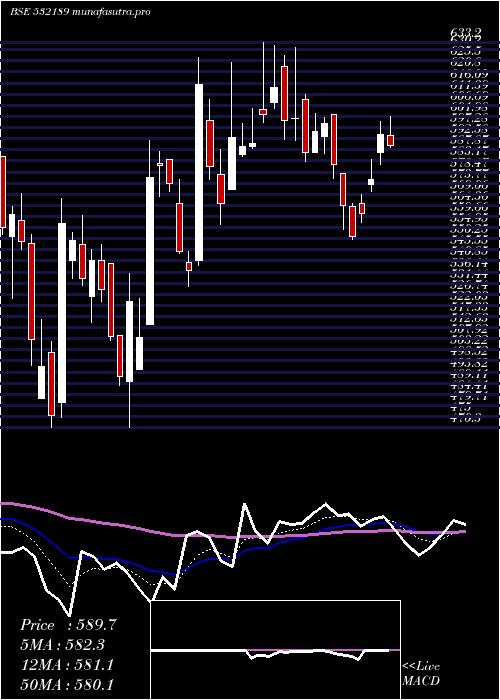
Daily price and volume India Touris
| Date |
Closing |
Open |
Range |
Volume |
Thu 23 October 2025 |
615.15 (-0.75%) |
610.05 |
610.05 - 621.35 |
0.1645 times |
Tue 21 October 2025 |
619.80 (0.31%) |
629.75 |
614.00 - 629.75 |
0.1355 times |
Mon 20 October 2025 |
617.90 (1.22%) |
622.30 |
610.00 - 623.00 |
0.6161 times |
Fri 17 October 2025 |
610.45 (-2.46%) |
615.00 |
610.00 - 624.65 |
0.3836 times |
Thu 16 October 2025 |
625.85 (1.68%) |
612.50 |
612.50 - 641.65 |
2.7137 times |
Wed 15 October 2025 |
615.50 (1.1%) |
603.05 |
603.05 - 619.05 |
0.3732 times |
Tue 14 October 2025 |
608.80 (-1.73%) |
612.30 |
604.40 - 623.30 |
1.622 times |
Mon 13 October 2025 |
619.50 (-1.44%) |
623.05 |
617.10 - 625.45 |
0.4981 times |
Fri 10 October 2025 |
628.55 (-1.84%) |
633.00 |
623.30 - 633.90 |
1.0182 times |
Thu 09 October 2025 |
640.30 (1.85%) |
627.95 |
627.95 - 667.30 |
2.475 times |
Wed 08 October 2025 |
628.65 (-2.19%) |
643.50 |
627.00 - 649.90 |
0.6731 times |
Weekly price and charts IndiaTouris Strong weekly Stock price targets for IndiaTouris 532189 are 602.7 and 622.45 | Weekly Target 1 | 598.55 | | Weekly Target 2 | 606.85 | | Weekly Target 3 | 618.3 | | Weekly Target 4 | 626.6 | | Weekly Target 5 | 638.05 |
Weekly price and volumes for India Touris
| Date |
Closing |
Open |
Range |
Volume |
Thu 23 October 2025 |
615.15 (0.77%) |
622.30 |
610.00 - 629.75 |
0.0305 times |
Fri 17 October 2025 |
610.45 (-2.88%) |
623.05 |
603.05 - 641.65 |
0.186 times |
Fri 10 October 2025 |
628.55 (4.63%) |
590.00 |
590.00 - 714.05 |
4.1142 times |
Fri 03 October 2025 |
600.75 (3%) |
585.00 |
571.00 - 605.45 |
0.0571 times |
Fri 26 September 2025 |
583.25 (-7.33%) |
629.40 |
579.50 - 639.30 |
0.155 times |
Fri 19 September 2025 |
629.40 (-3.05%) |
643.05 |
624.60 - 666.95 |
0.5847 times |
Fri 12 September 2025 |
649.20 (18.34%) |
552.90 |
542.10 - 710.85 |
4.7625 times |
Fri 05 September 2025 |
548.60 (4.37%) |
523.95 |
523.95 - 566.00 |
0.0411 times |
Fri 29 August 2025 |
525.65 (-4.67%) |
550.00 |
522.00 - 553.20 |
0.0327 times |
Fri 22 August 2025 |
551.40 (2.61%) |
533.00 |
533.00 - 570.10 |
0.0361 times |
Thu 14 August 2025 |
537.35 (-3.1%) |
565.00 |
532.20 - 565.00 |
0.0298 times |

Monthly price and charts IndiaTouris Strong monthly Stock price targets for IndiaTouris 532189 are 593.38 and 735.83 | Monthly Target 1 | 491.15 | | Monthly Target 2 | 553.15 | | Monthly Target 3 | 633.6 | | Monthly Target 4 | 695.6 | | Monthly Target 5 | 776.05 |
Monthly price and volumes India Touris
| Date |
Closing |
Open |
Range |
Volume |
Thu 23 October 2025 |
615.15 (7%) |
571.60 |
571.60 - 714.05 |
2.9845 times |
Tue 30 September 2025 |
574.90 (9.37%) |
523.95 |
523.95 - 710.85 |
3.7857 times |
Fri 29 August 2025 |
525.65 (-9.37%) |
582.00 |
522.00 - 593.60 |
0.0986 times |
Thu 31 July 2025 |
580.00 (-4.83%) |
610.10 |
567.80 - 635.00 |
0.1503 times |
Mon 30 June 2025 |
609.45 (-2.25%) |
633.50 |
572.80 - 646.95 |
0.2287 times |
Fri 30 May 2025 |
623.50 (11.34%) |
558.00 |
519.55 - 636.95 |
0.4231 times |
Wed 30 April 2025 |
560.00 (-4.56%) |
586.75 |
550.00 - 610.70 |
0.193 times |
Fri 28 March 2025 |
586.75 (19.23%) |
490.00 |
470.55 - 633.20 |
1.0836 times |
Fri 28 February 2025 |
492.10 (-20.76%) |
645.25 |
470.30 - 658.75 |
0.3601 times |
Fri 31 January 2025 |
621.00 (0.28%) |
612.05 |
526.05 - 739.90 |
0.6925 times |
Tue 31 December 2024 |
619.25 (-3.53%) |
647.95 |
595.05 - 684.90 |
0.2204 times |

DMA SMA EMA moving averages of India Touris 532189
DMA (daily moving average) of India Touris 532189
| DMA period | DMA value | | 5 day DMA | 617.83 | | 12 day DMA | 622.77 | | 20 day DMA | 613.86 | | 35 day DMA | 614.31 | | 50 day DMA | 592.96 | | 100 day DMA | 596.13 | | 150 day DMA | 591.82 | | 200 day DMA | 590.3 | EMA (exponential moving average) of India Touris 532189
| EMA period | EMA current | EMA prev | EMA prev2 | | 5 day EMA | 617.35 | 618.45 | 617.78 | | 12 day EMA | 618.09 | 618.62 | 618.4 | | 20 day EMA | 615.79 | 615.86 | 615.44 | | 35 day EMA | 603.69 | 603.02 | 602.03 | | 50 day EMA | 593 | 592.1 | 590.97 |
SMA (simple moving average) of India Touris 532189
| SMA period | SMA current | SMA prev | SMA prev2 | | 5 day SMA | 617.83 | 617.9 | 615.7 | | 12 day SMA | 622.77 | 627.62 | 626.03 | | 20 day SMA | 613.86 | 614.17 | 613.96 | | 35 day SMA | 614.31 | 612.16 | 609.71 | | 50 day SMA | 592.96 | 591.75 | 590.44 | | 100 day SMA | 596.13 | 596.21 | 596.27 | | 150 day SMA | 591.82 | 591.59 | 591.3 | | 200 day SMA | 590.3 | 590.26 | 590.23 |
|
|
