IndusindBnk 532187 full analysis,charts,indicators,moving averages,SMA,DMA,EMA,ADX,MACD,RSIIndusind Bnk 532187 WideScreen charts, DMA,SMA,EMA technical analysis, forecast prediction, by indicators ADX,MACD,RSI,CCI BSE stock exchange
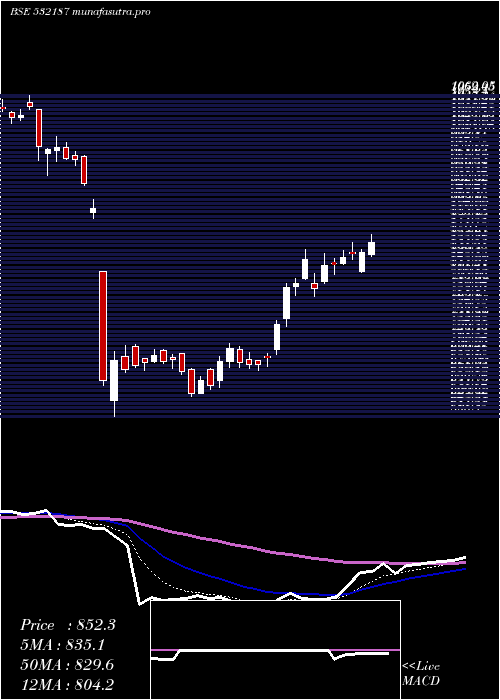
Daily price and charts and targets IndusindBnk Strong Daily Stock price targets for IndusindBnk 532187 are 862.98 and 881.38 | Daily Target 1 | 848.38 | | Daily Target 2 | 859.17 | | Daily Target 3 | 866.78333333333 | | Daily Target 4 | 877.57 | | Daily Target 5 | 885.18 |
Daily price and volume Indusind Bnk
| Date |
Closing |
Open |
Range |
Volume |
Fri 05 December 2025 |
869.95 (0.77%) |
864.90 |
856.00 - 874.40 |
0.7307 times |
Thu 04 December 2025 |
863.30 (1.99%) |
845.05 |
843.05 - 872.80 |
0.8577 times |
Wed 03 December 2025 |
846.45 (-0.47%) |
852.80 |
842.00 - 856.00 |
0.4067 times |
Tue 02 December 2025 |
850.45 (0.41%) |
847.85 |
845.35 - 860.55 |
0.2589 times |
Mon 01 December 2025 |
847.00 (-1.32%) |
862.95 |
843.30 - 862.95 |
0.203 times |
Fri 28 November 2025 |
858.30 (0.09%) |
860.70 |
851.40 - 862.85 |
0.6396 times |
Thu 27 November 2025 |
857.50 (0.82%) |
850.70 |
847.00 - 863.65 |
0.5962 times |
Wed 26 November 2025 |
850.50 (1.24%) |
840.80 |
840.80 - 858.35 |
0.996 times |
Tue 25 November 2025 |
840.05 (0.5%) |
832.45 |
829.50 - 843.90 |
4.2417 times |
Mon 24 November 2025 |
835.90 (-1.26%) |
847.00 |
833.30 - 857.30 |
1.0695 times |
Fri 21 November 2025 |
846.55 (2.06%) |
830.05 |
830.05 - 857.05 |
3.1682 times |
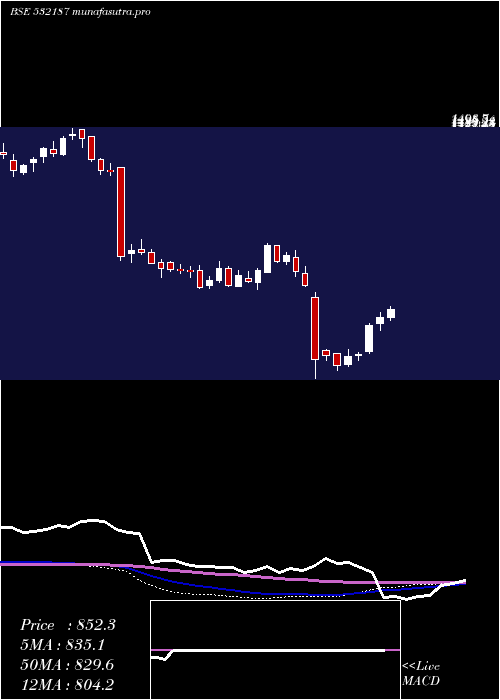
Weekly price and charts IndusindBnk Strong weekly Stock price targets for IndusindBnk 532187 are 855.98 and 888.38 | Weekly Target 1 | 829.72 | | Weekly Target 2 | 849.83 | | Weekly Target 3 | 862.11666666667 | | Weekly Target 4 | 882.23 | | Weekly Target 5 | 894.52 |
Weekly price and volumes for Indusind Bnk
| Date |
Closing |
Open |
Range |
Volume |
Fri 05 December 2025 |
869.95 (1.36%) |
862.95 |
842.00 - 874.40 |
0.3235 times |
Fri 28 November 2025 |
858.30 (1.39%) |
847.00 |
829.50 - 863.65 |
0.9932 times |
Fri 21 November 2025 |
846.55 (-0.15%) |
850.30 |
827.30 - 860.15 |
0.7834 times |
Fri 14 November 2025 |
847.85 (6.4%) |
791.05 |
791.05 - 891.95 |
2.6279 times |
Fri 07 November 2025 |
796.85 (0.35%) |
791.10 |
777.00 - 803.50 |
0.8205 times |
Fri 31 October 2025 |
794.10 (4.47%) |
755.45 |
752.85 - 810.05 |
2.0132 times |
Thu 23 October 2025 |
760.10 (1.15%) |
740.30 |
725.90 - 770.45 |
0.5814 times |
Fri 17 October 2025 |
751.45 (-1.58%) |
756.65 |
733.75 - 767.75 |
0.5302 times |
Fri 10 October 2025 |
763.50 (2.13%) |
742.00 |
734.10 - 766.25 |
0.6894 times |
Fri 03 October 2025 |
747.55 (4.87%) |
718.75 |
712.75 - 759.00 |
0.6373 times |
Fri 26 September 2025 |
712.85 (-4.1%) |
743.35 |
710.85 - 759.00 |
0.6601 times |
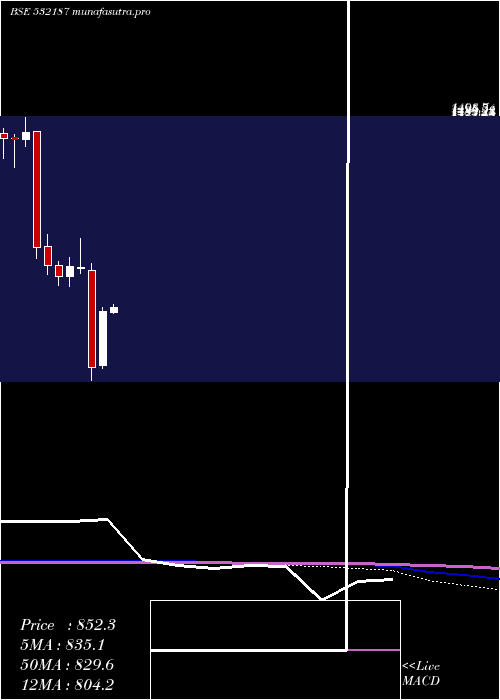
Monthly price and charts IndusindBnk Strong monthly Stock price targets for IndusindBnk 532187 are 855.98 and 888.38 | Monthly Target 1 | 829.72 | | Monthly Target 2 | 849.83 | | Monthly Target 3 | 862.11666666667 | | Monthly Target 4 | 882.23 | | Monthly Target 5 | 894.52 |
Monthly price and volumes Indusind Bnk
| Date |
Closing |
Open |
Range |
Volume |
Fri 05 December 2025 |
869.95 (1.36%) |
862.95 |
842.00 - 874.40 |
0.0482 times |
Fri 28 November 2025 |
858.30 (8.08%) |
791.10 |
777.00 - 891.95 |
0.7779 times |
Fri 31 October 2025 |
794.10 (7.97%) |
735.00 |
725.90 - 810.05 |
0.6051 times |
Tue 30 September 2025 |
735.50 (-0.59%) |
744.80 |
710.85 - 773.95 |
0.3792 times |
Fri 29 August 2025 |
739.90 (-7.38%) |
792.05 |
738.00 - 848.80 |
0.4579 times |
Thu 31 July 2025 |
798.85 (-8.37%) |
871.75 |
789.45 - 893.00 |
0.5923 times |
Mon 30 June 2025 |
871.80 (6.69%) |
810.35 |
798.45 - 880.85 |
0.6939 times |
Fri 30 May 2025 |
817.10 (-2.55%) |
835.95 |
725.65 - 863.80 |
1.6038 times |
Wed 30 April 2025 |
838.45 (29.08%) |
655.80 |
646.85 - 852.40 |
1.8752 times |
Fri 28 March 2025 |
649.55 (-34.32%) |
979.40 |
605.40 - 1003.70 |
2.9665 times |
Fri 28 February 2025 |
988.95 (-0.32%) |
985.15 |
968.80 - 1086.50 |
0.3365 times |
DMA SMA EMA moving averages of Indusind Bnk 532187
DMA (daily moving average) of Indusind Bnk 532187
| DMA period | DMA value | | 5 day DMA | 855.43 | | 12 day DMA | 849.62 | | 20 day DMA | 844.75 | | 35 day DMA | 814.32 | | 50 day DMA | 792.75 | | 100 day DMA | 791.71 | | 150 day DMA | 802.31 | | 200 day DMA | 817.25 | EMA (exponential moving average) of Indusind Bnk 532187
| EMA period | EMA current | EMA prev | EMA prev2 | | 5 day EMA | 859.14 | 853.74 | 848.96 | | 12 day EMA | 850.71 | 847.21 | 844.28 | | 20 day EMA | 839.88 | 836.72 | 833.92 | | 35 day EMA | 818.66 | 815.64 | 812.83 | | 50 day EMA | 794.72 | 791.65 | 788.73 |
SMA (simple moving average) of Indusind Bnk 532187
| SMA period | SMA current | SMA prev | SMA prev2 | | 5 day SMA | 855.43 | 853.1 | 851.94 | | 12 day SMA | 849.62 | 847.79 | 847.02 | | 20 day SMA | 844.75 | 840.56 | 836.87 | | 35 day SMA | 814.32 | 811.17 | 808.32 | | 50 day SMA | 792.75 | 790.21 | 787.66 | | 100 day SMA | 791.71 | 791.42 | 791.29 | | 150 day SMA | 802.31 | 802.05 | 801.78 | | 200 day SMA | 817.25 | 817.96 | 818.6 |
|
|
