SaregamaI 532163 full analysis,charts,indicators,moving averages,SMA,DMA,EMA,ADX,MACD,RSISaregama I 532163 WideScreen charts, DMA,SMA,EMA technical analysis, forecast prediction, by indicators ADX,MACD,RSI,CCI BSE stock exchange
Daily price and charts and targets SaregamaI Strong Daily Stock price targets for SaregamaI 532163 are 365.1 and 376 | Daily Target 1 | 356.38 | | Daily Target 2 | 362.92 | | Daily Target 3 | 367.28333333333 | | Daily Target 4 | 373.82 | | Daily Target 5 | 378.18 |
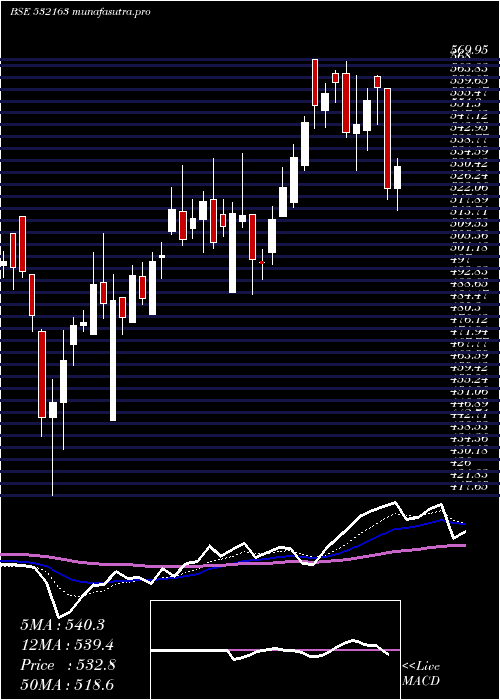
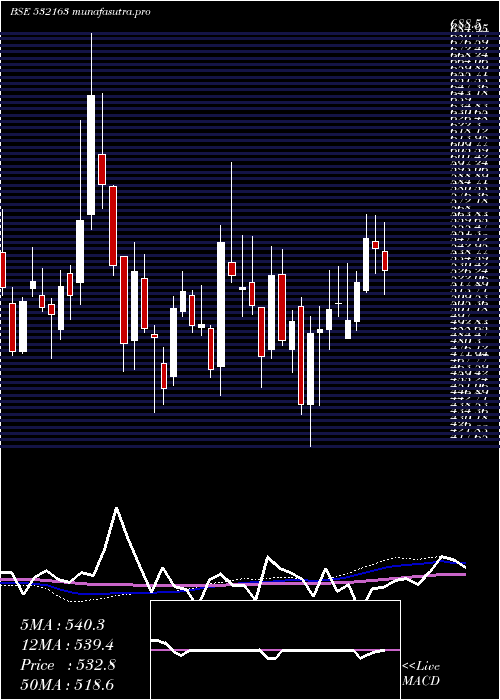
Daily price and volume Saregama I
| Date |
Closing |
Open |
Range |
Volume |
Fri 05 December 2025 |
369.45 (0.27%) |
368.45 |
360.75 - 371.65 |
0.5266 times |
Thu 04 December 2025 |
368.45 (-0.67%) |
371.00 |
366.00 - 371.85 |
0.3864 times |
Wed 03 December 2025 |
370.95 (-3.1%) |
381.20 |
370.00 - 386.25 |
0.3507 times |
Tue 02 December 2025 |
382.80 (-3.36%) |
393.55 |
379.15 - 393.55 |
0.802 times |
Mon 01 December 2025 |
396.10 (-0.39%) |
395.05 |
393.45 - 407.70 |
0.4574 times |
Fri 28 November 2025 |
397.65 (-0.66%) |
395.55 |
394.55 - 409.85 |
1.2758 times |
Thu 27 November 2025 |
400.30 (4.78%) |
382.05 |
380.50 - 407.00 |
5.2094 times |
Wed 26 November 2025 |
382.05 (3.02%) |
369.25 |
369.25 - 385.20 |
0.3537 times |
Tue 25 November 2025 |
370.85 (-0.12%) |
368.25 |
364.80 - 375.85 |
0.2835 times |
Mon 24 November 2025 |
371.30 (-1.03%) |
375.50 |
365.25 - 376.40 |
0.3544 times |
Fri 21 November 2025 |
375.15 (-3.47%) |
387.55 |
374.50 - 387.55 |
0.2412 times |
Weekly price and charts SaregamaI Strong weekly Stock price targets for SaregamaI 532163 are 341.63 and 388.58 | Weekly Target 1 | 332.35 | | Weekly Target 2 | 350.9 | | Weekly Target 3 | 379.3 | | Weekly Target 4 | 397.85 | | Weekly Target 5 | 426.25 |
Weekly price and volumes for Saregama I
| Date |
Closing |
Open |
Range |
Volume |
Fri 05 December 2025 |
369.45 (-7.09%) |
395.05 |
360.75 - 407.70 |
1.5164 times |
Fri 28 November 2025 |
397.65 (6%) |
375.50 |
364.80 - 409.85 |
4.4936 times |
Fri 21 November 2025 |
375.15 (-6.2%) |
399.55 |
374.50 - 403.35 |
0.5773 times |
Fri 14 November 2025 |
399.95 (-2.28%) |
412.35 |
395.30 - 423.00 |
1.0165 times |
Fri 07 November 2025 |
409.30 (-9.93%) |
454.80 |
402.40 - 460.00 |
0.5058 times |
Fri 31 October 2025 |
454.40 (0.41%) |
458.85 |
451.80 - 462.35 |
0.2714 times |
Thu 23 October 2025 |
452.55 (0.39%) |
449.90 |
449.40 - 463.35 |
0.2059 times |
Fri 17 October 2025 |
450.80 (-0.32%) |
457.05 |
447.90 - 470.60 |
0.6754 times |
Fri 10 October 2025 |
452.25 (-4.33%) |
472.70 |
450.00 - 473.60 |
0.3594 times |
Fri 03 October 2025 |
472.70 (-0.07%) |
469.15 |
460.40 - 478.00 |
0.3783 times |
Fri 26 September 2025 |
473.05 (-3.72%) |
491.50 |
467.20 - 494.00 |
0.4763 times |
Monthly price and charts SaregamaI Strong monthly Stock price targets for SaregamaI 532163 are 341.63 and 388.58 | Monthly Target 1 | 332.35 | | Monthly Target 2 | 350.9 | | Monthly Target 3 | 379.3 | | Monthly Target 4 | 397.85 | | Monthly Target 5 | 426.25 |
Monthly price and volumes Saregama I
| Date |
Closing |
Open |
Range |
Volume |
Fri 05 December 2025 |
369.45 (-7.09%) |
395.05 |
360.75 - 407.70 |
0.4208 times |
Fri 28 November 2025 |
397.65 (-12.49%) |
454.80 |
364.80 - 460.00 |
1.8297 times |
Fri 31 October 2025 |
454.40 (-2.68%) |
464.10 |
447.90 - 478.00 |
0.4608 times |
Tue 30 September 2025 |
466.90 (-3.14%) |
478.05 |
460.40 - 517.60 |
0.769 times |
Fri 29 August 2025 |
482.05 (-0.27%) |
480.10 |
469.00 - 516.00 |
0.9531 times |
Thu 31 July 2025 |
483.35 (-3.05%) |
498.60 |
466.20 - 520.00 |
1.5822 times |
Mon 30 June 2025 |
498.55 (-7.91%) |
560.00 |
492.05 - 603.00 |
1.3493 times |
Fri 30 May 2025 |
541.40 (3.13%) |
525.00 |
517.40 - 564.95 |
0.84 times |
Wed 30 April 2025 |
524.95 (2.61%) |
488.60 |
488.00 - 569.95 |
1.0221 times |
Fri 28 March 2025 |
511.60 (15.01%) |
445.05 |
417.65 - 535.40 |
0.773 times |
Fri 28 February 2025 |
444.85 (-6.58%) |
480.85 |
438.20 - 548.70 |
2.3658 times |

DMA SMA EMA moving averages of Saregama I 532163
DMA (daily moving average) of Saregama I 532163
| DMA period | DMA value | | 5 day DMA | 377.55 | | 12 day DMA | 381.14 | | 20 day DMA | 390.43 | | 35 day DMA | 417.67 | | 50 day DMA | 432.93 | | 100 day DMA | 460.55 | | 150 day DMA | 484.71 | | 200 day DMA | 490.57 | EMA (exponential moving average) of Saregama I 532163
| EMA period | EMA current | EMA prev | EMA prev2 | | 5 day EMA | 375.3 | 378.22 | 383.1 | | 12 day EMA | 383.96 | 386.6 | 389.9 | | 20 day EMA | 394.3 | 396.91 | 399.9 | | 35 day EMA | 411.98 | 414.48 | 417.19 | | 50 day EMA | 432.23 | 434.79 | 437.5 |
SMA (simple moving average) of Saregama I 532163
| SMA period | SMA current | SMA prev | SMA prev2 | | 5 day SMA | 377.55 | 383.19 | 389.56 | | 12 day SMA | 381.14 | 383.4 | 385.73 | | 20 day SMA | 390.43 | 393.32 | 397.51 | | 35 day SMA | 417.67 | 420.25 | 422.65 | | 50 day SMA | 432.93 | 435.36 | 437.85 | | 100 day SMA | 460.55 | 461.87 | 463.12 | | 150 day SMA | 484.71 | 485.96 | 487.15 | | 200 day SMA | 490.57 | 491.43 | 491.96 |
|
|
