Indraprast 532150 full analysis,charts,indicators,moving averages,SMA,DMA,EMA,ADX,MACD,RSIIndraprast 532150 WideScreen charts, DMA,SMA,EMA technical analysis, forecast prediction, by indicators ADX,MACD,RSI,CCI BSE stock exchange
Daily price and charts and targets Indraprast Strong Daily Stock price targets for Indraprast 532150 are 553.53 and 569.13 | Daily Target 1 | 550.62 | | Daily Target 2 | 556.43 | | Daily Target 3 | 566.21666666667 | | Daily Target 4 | 572.03 | | Daily Target 5 | 581.82 |
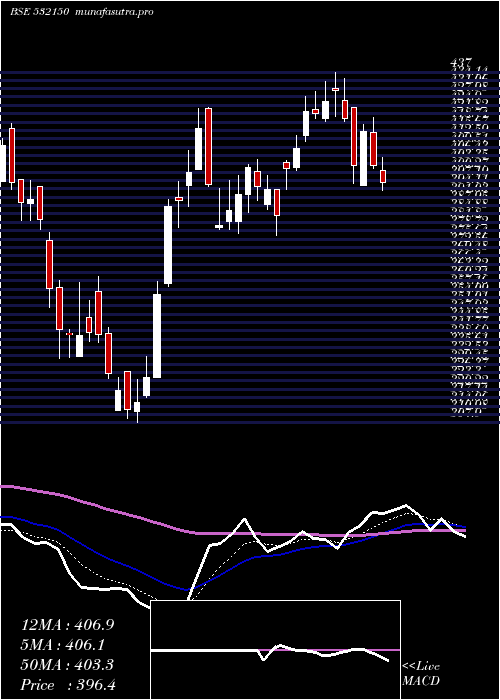
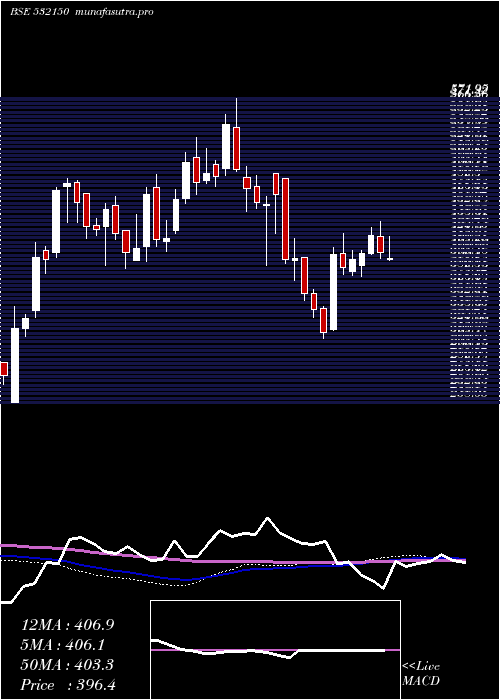
Daily price and volume Indraprast
| Date |
Closing |
Open |
Range |
Volume |
Tue 21 October 2025 |
562.25 (-1%) |
576.00 |
560.40 - 576.00 |
0.024 times |
Mon 20 October 2025 |
567.95 (2.15%) |
569.30 |
555.80 - 573.05 |
0.0683 times |
Fri 17 October 2025 |
556.00 (0.35%) |
554.00 |
552.40 - 572.00 |
0.1178 times |
Thu 16 October 2025 |
554.05 (-1.33%) |
566.65 |
553.00 - 579.00 |
0.0754 times |
Wed 15 October 2025 |
561.50 (-2.29%) |
576.65 |
549.45 - 576.65 |
0.1533 times |
Tue 14 October 2025 |
574.65 (1.43%) |
566.25 |
547.95 - 586.15 |
0.0915 times |
Mon 13 October 2025 |
566.55 (0.04%) |
564.05 |
560.40 - 570.00 |
0.1546 times |
Fri 10 October 2025 |
566.30 (2.12%) |
555.20 |
541.65 - 574.40 |
0.2119 times |
Thu 09 October 2025 |
554.55 (0.33%) |
554.75 |
546.65 - 570.00 |
0.4553 times |
Wed 08 October 2025 |
552.70 (-3.68%) |
582.00 |
534.05 - 625.50 |
8.6479 times |
Tue 07 October 2025 |
573.80 (19.99%) |
483.00 |
474.55 - 573.80 |
3.5356 times |
Weekly price and charts Indraprast Strong weekly Stock price targets for Indraprast 532150 are 548.93 and 569.13 | Weekly Target 1 | 544.48 | | Weekly Target 2 | 553.37 | | Weekly Target 3 | 564.68333333333 | | Weekly Target 4 | 573.57 | | Weekly Target 5 | 584.88 |
Weekly price and volumes for Indraprast
| Date |
Closing |
Open |
Range |
Volume |
Tue 21 October 2025 |
562.25 (1.12%) |
569.30 |
555.80 - 576.00 |
0.0533 times |
Fri 17 October 2025 |
556.00 (-1.82%) |
564.05 |
547.95 - 586.15 |
0.3426 times |
Fri 10 October 2025 |
566.30 (22.59%) |
462.45 |
462.05 - 625.50 |
7.4886 times |
Fri 03 October 2025 |
461.95 (3.67%) |
448.55 |
438.75 - 471.55 |
0.1712 times |
Fri 26 September 2025 |
445.60 (-5.96%) |
465.00 |
441.00 - 473.50 |
0.1411 times |
Fri 19 September 2025 |
473.85 (-3.17%) |
489.35 |
459.00 - 497.20 |
0.3672 times |
Fri 12 September 2025 |
489.35 (1.43%) |
482.50 |
470.45 - 522.00 |
0.6943 times |
Fri 05 September 2025 |
482.45 (10%) |
445.05 |
437.75 - 499.30 |
0.4008 times |
Fri 29 August 2025 |
438.60 (-4.53%) |
461.55 |
437.15 - 461.55 |
0.0889 times |
Fri 22 August 2025 |
459.40 (0.73%) |
474.85 |
451.00 - 483.95 |
0.2521 times |
Thu 14 August 2025 |
456.05 (1.38%) |
445.85 |
442.80 - 476.75 |
0.1244 times |
Monthly price and charts Indraprast Strong monthly Stock price targets for Indraprast 532150 are 501.88 and 685.88 | Monthly Target 1 | 359.08 | | Monthly Target 2 | 460.67 | | Monthly Target 3 | 543.08333333333 | | Monthly Target 4 | 644.67 | | Monthly Target 5 | 727.08 |
Monthly price and volumes Indraprast
| Date |
Closing |
Open |
Range |
Volume |
Tue 21 October 2025 |
562.25 (26.35%) |
446.50 |
441.50 - 625.50 |
3.6795 times |
Tue 30 September 2025 |
445.00 (1.46%) |
445.05 |
437.75 - 522.00 |
0.758 times |
Fri 29 August 2025 |
438.60 (-6.74%) |
470.30 |
431.65 - 488.00 |
0.4804 times |
Thu 31 July 2025 |
470.30 (-3.22%) |
486.15 |
446.50 - 522.35 |
0.9323 times |
Mon 30 June 2025 |
485.95 (10.21%) |
441.55 |
387.25 - 502.40 |
0.6738 times |
Fri 30 May 2025 |
440.95 (11.24%) |
398.00 |
366.25 - 456.10 |
0.5398 times |
Wed 30 April 2025 |
396.40 (2.68%) |
382.00 |
376.75 - 437.00 |
0.4168 times |
Fri 28 March 2025 |
386.05 (7.97%) |
357.90 |
307.90 - 424.00 |
0.7659 times |
Fri 28 February 2025 |
357.55 (-21.52%) |
489.70 |
350.25 - 489.70 |
0.4988 times |
Fri 31 January 2025 |
455.60 (-12.87%) |
534.90 |
388.25 - 571.95 |
1.2546 times |
Tue 31 December 2024 |
522.90 (13.3%) |
462.45 |
456.55 - 529.65 |
1.2635 times |

DMA SMA EMA moving averages of Indraprast 532150
DMA (daily moving average) of Indraprast 532150
| DMA period | DMA value | | 5 day DMA | 560.35 | | 12 day DMA | 555.71 | | 20 day DMA | 514.55 | | 35 day DMA | 500.1 | | 50 day DMA | 487.57 | | 100 day DMA | 470.53 | | 150 day DMA | 445.3 | | 200 day DMA | 446.98 | EMA (exponential moving average) of Indraprast 532150
| EMA period | EMA current | EMA prev | EMA prev2 | | 5 day EMA | 561.22 | 560.7 | 557.07 | | 12 day EMA | 546.48 | 543.61 | 539.19 | | 20 day EMA | 529.82 | 526.41 | 522.04 | | 35 day EMA | 509.41 | 506.3 | 502.67 | | 50 day EMA | 491.94 | 489.07 | 485.85 |
SMA (simple moving average) of Indraprast 532150
| SMA period | SMA current | SMA prev | SMA prev2 | | 5 day SMA | 560.35 | 562.83 | 562.55 | | 12 day SMA | 555.71 | 547.35 | 538.02 | | 20 day SMA | 514.55 | 509.63 | 504.92 | | 35 day SMA | 500.1 | 496.83 | 493.14 | | 50 day SMA | 487.57 | 485.55 | 483.08 | | 100 day SMA | 470.53 | 469.3 | 468.04 | | 150 day SMA | 445.3 | 443.81 | 442.3 | | 200 day SMA | 446.98 | 446.56 | 446.16 |
|
|
