AndhraCemen 532141 full analysis,charts,indicators,moving averages,SMA,DMA,EMA,ADX,MACD,RSIAndhra Cemen 532141 WideScreen charts, DMA,SMA,EMA technical analysis, forecast prediction, by indicators ADX,MACD,RSI,CCI BSE stock exchange
Daily price and charts and targets AndhraCemen Strong Daily Stock price targets for AndhraCemen 532141 are 75.55 and 77.84 | Daily Target 1 | 75.07 | | Daily Target 2 | 76.03 | | Daily Target 3 | 77.363333333333 | | Daily Target 4 | 78.32 | | Daily Target 5 | 79.65 |
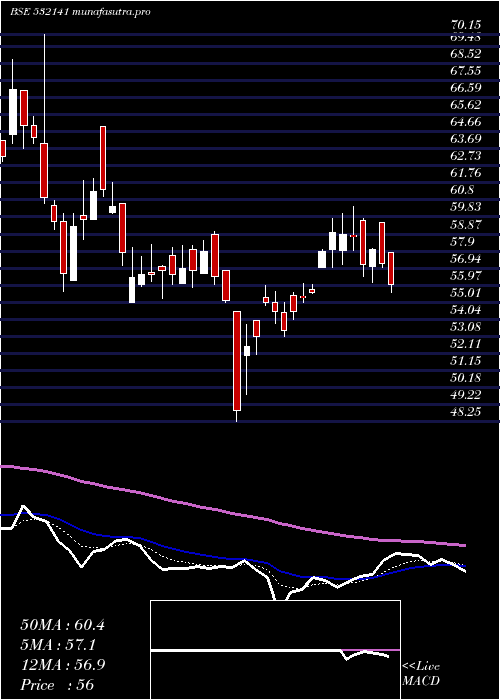
Daily price and volume Andhra Cemen
| Date |
Closing |
Open |
Range |
Volume |
Thu 23 October 2025 |
76.98 (-0.56%) |
78.20 |
76.41 - 78.70 |
1.6231 times |
Tue 21 October 2025 |
77.41 (3.25%) |
77.70 |
74.97 - 78.20 |
1.3405 times |
Mon 20 October 2025 |
74.97 (0.56%) |
73.60 |
73.60 - 75.89 |
0.3531 times |
Fri 17 October 2025 |
74.55 (-0.59%) |
77.90 |
73.90 - 77.90 |
0.3425 times |
Thu 16 October 2025 |
74.99 (-1.68%) |
75.10 |
74.20 - 77.78 |
1.4038 times |
Wed 15 October 2025 |
76.27 (-2.13%) |
79.50 |
74.05 - 79.50 |
0.4358 times |
Tue 14 October 2025 |
77.93 (-2.83%) |
78.00 |
76.65 - 80.00 |
0.5558 times |
Mon 13 October 2025 |
80.20 (-3.47%) |
83.99 |
79.60 - 83.99 |
0.2489 times |
Fri 10 October 2025 |
83.08 (-1.99%) |
86.00 |
83.08 - 86.00 |
1.5607 times |
Thu 09 October 2025 |
84.77 (-2%) |
85.57 |
84.77 - 86.50 |
2.1359 times |
Wed 08 October 2025 |
86.50 (1.99%) |
83.12 |
83.12 - 86.50 |
2.3917 times |
Weekly price and charts AndhraCemen Strong weekly Stock price targets for AndhraCemen 532141 are 75.29 and 80.39 | Weekly Target 1 | 71.33 | | Weekly Target 2 | 74.15 | | Weekly Target 3 | 76.426666666667 | | Weekly Target 4 | 79.25 | | Weekly Target 5 | 81.53 |
Weekly price and volumes for Andhra Cemen
| Date |
Closing |
Open |
Range |
Volume |
Thu 23 October 2025 |
76.98 (3.26%) |
73.60 |
73.60 - 78.70 |
0.1644 times |
Fri 17 October 2025 |
74.55 (-10.27%) |
83.99 |
73.90 - 83.99 |
0.1481 times |
Fri 10 October 2025 |
83.08 (1.91%) |
79.89 |
79.89 - 86.50 |
0.4065 times |
Fri 03 October 2025 |
81.52 (-7.74%) |
86.60 |
81.52 - 86.60 |
0.0275 times |
Fri 26 September 2025 |
88.36 (-8%) |
94.12 |
88.36 - 94.12 |
0.1596 times |
Fri 19 September 2025 |
96.04 (3.16%) |
91.24 |
91.24 - 100.00 |
0.9758 times |
Fri 12 September 2025 |
93.10 (-10.98%) |
109.80 |
93.10 - 109.80 |
1.5524 times |
Fri 05 September 2025 |
104.58 (22.78%) |
89.00 |
80.95 - 104.58 |
2.9493 times |
Fri 29 August 2025 |
85.18 (16.24%) |
71.90 |
71.90 - 93.09 |
2.782 times |
Fri 22 August 2025 |
73.28 (17.78%) |
62.48 |
62.45 - 73.79 |
0.8345 times |
Thu 14 August 2025 |
62.22 (-0.64%) |
61.55 |
58.01 - 66.38 |
0.1541 times |

Monthly price and charts AndhraCemen Strong monthly Stock price targets for AndhraCemen 532141 are 68.84 and 81.74 | Monthly Target 1 | 66.13 | | Monthly Target 2 | 71.55 | | Monthly Target 3 | 79.026666666667 | | Monthly Target 4 | 84.45 | | Monthly Target 5 | 91.93 |
Monthly price and volumes Andhra Cemen
| Date |
Closing |
Open |
Range |
Volume |
Thu 23 October 2025 |
76.98 (-9.3%) |
83.18 |
73.60 - 86.50 |
0.2602 times |
Tue 30 September 2025 |
84.87 (-0.36%) |
89.00 |
80.95 - 109.80 |
2.0208 times |
Fri 29 August 2025 |
85.18 (24.44%) |
68.75 |
58.01 - 93.09 |
1.4543 times |
Thu 31 July 2025 |
68.45 (2.32%) |
66.90 |
65.41 - 73.00 |
0.7248 times |
Mon 30 June 2025 |
66.90 (3.1%) |
69.98 |
62.81 - 74.99 |
0.5499 times |
Fri 30 May 2025 |
64.89 (15.88%) |
55.02 |
52.46 - 65.00 |
0.9266 times |
Wed 30 April 2025 |
56.00 (14.57%) |
52.00 |
49.80 - 60.40 |
0.7575 times |
Fri 28 March 2025 |
48.88 (-17.97%) |
59.59 |
48.25 - 64.97 |
1.7222 times |
Fri 28 February 2025 |
59.59 (-17.77%) |
72.85 |
57.00 - 72.85 |
1.0748 times |
Fri 31 January 2025 |
72.47 (-14.58%) |
83.38 |
68.35 - 86.97 |
0.509 times |
Tue 31 December 2024 |
84.84 (5.9%) |
80.86 |
79.92 - 93.94 |
0.7303 times |

DMA SMA EMA moving averages of Andhra Cemen 532141
DMA (daily moving average) of Andhra Cemen 532141
| DMA period | DMA value | | 5 day DMA | 75.78 | | 12 day DMA | 79.37 | | 20 day DMA | 82.12 | | 35 day DMA | 88.3 | | 50 day DMA | 84.27 | | 100 day DMA | 75.78 | | 150 day DMA | 69.47 | | 200 day DMA | 69.97 | EMA (exponential moving average) of Andhra Cemen 532141
| EMA period | EMA current | EMA prev | EMA prev2 | | 5 day EMA | 76.75 | 76.64 | 76.26 | | 12 day EMA | 78.99 | 79.35 | 79.7 | | 20 day EMA | 81.11 | 81.55 | 81.99 | | 35 day EMA | 81.26 | 81.51 | 81.75 | | 50 day EMA | 81.78 | 81.98 | 82.17 |
SMA (simple moving average) of Andhra Cemen 532141
| SMA period | SMA current | SMA prev | SMA prev2 | | 5 day SMA | 75.78 | 75.64 | 75.74 | | 12 day SMA | 79.37 | 79.89 | 80.23 | | 20 day SMA | 82.12 | 82.88 | 83.71 | | 35 day SMA | 88.3 | 88.76 | 89.08 | | 50 day SMA | 84.27 | 83.99 | 83.7 | | 100 day SMA | 75.78 | 75.65 | 75.51 | | 150 day SMA | 69.47 | 69.36 | 69.25 | | 200 day SMA | 69.97 | 69.99 | 70.02 |
|
|
