Vandana 532090 full analysis,charts,indicators,moving averages,SMA,DMA,EMA,ADX,MACD,RSIVandana 532090 WideScreen charts, DMA,SMA,EMA technical analysis, forecast prediction, by indicators ADX,MACD,RSI,CCI BSE stock exchange
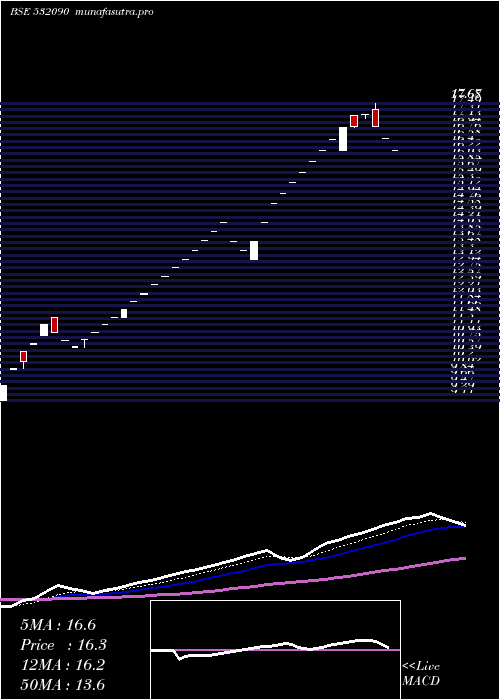
Daily price and charts and targets Vandana Strong Daily Stock price targets for Vandana 532090 are 16.39 and 17.24 | Daily Target 1 | 16.24 | | Daily Target 2 | 16.54 | | Daily Target 3 | 17.093333333333 | | Daily Target 4 | 17.39 | | Daily Target 5 | 17.94 |
Daily price and volume Vandana
| Date |
Closing |
Open |
Range |
Volume |
Wed 03 September 2025 |
16.83 (-1.52%) |
17.65 |
16.80 - 17.65 |
0.5697 times |
Tue 02 September 2025 |
17.09 (0.18%) |
17.55 |
16.61 - 17.55 |
0.7908 times |
Mon 01 September 2025 |
17.06 (-0.87%) |
16.90 |
16.90 - 17.68 |
1.1965 times |
Fri 29 August 2025 |
17.21 (-2.55%) |
18.38 |
17.06 - 18.38 |
1.3043 times |
Thu 28 August 2025 |
17.66 (-0.23%) |
16.05 |
16.05 - 18.74 |
1.7238 times |
Tue 26 August 2025 |
17.70 (-1.61%) |
17.50 |
16.70 - 18.50 |
0.5745 times |
Mon 25 August 2025 |
17.99 (-1.69%) |
18.50 |
17.50 - 18.50 |
0.6281 times |
Fri 22 August 2025 |
18.30 (-2.4%) |
18.99 |
17.01 - 19.19 |
1.9287 times |
Thu 21 August 2025 |
18.75 (0.21%) |
18.50 |
18.50 - 19.34 |
0.3904 times |
Wed 20 August 2025 |
18.71 (-0.43%) |
18.51 |
18.51 - 19.33 |
0.8931 times |
Tue 19 August 2025 |
18.79 (-0.48%) |
18.70 |
18.51 - 19.45 |
0.6861 times |
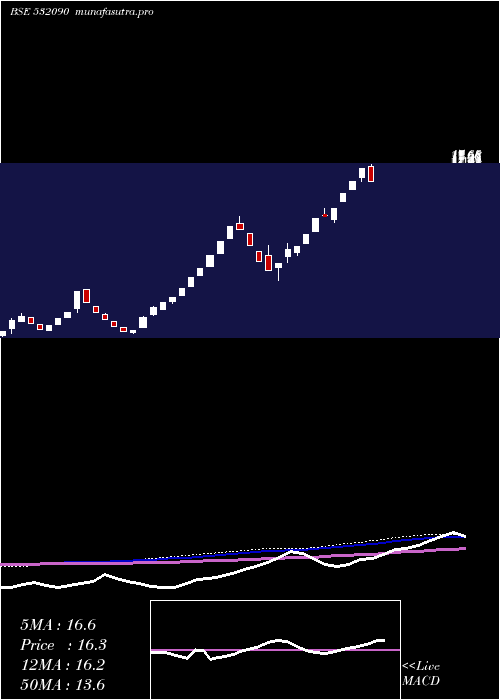
Weekly price and charts Vandana Strong weekly Stock price targets for Vandana 532090 are 16.19 and 17.26 | Weekly Target 1 | 15.97 | | Weekly Target 2 | 16.4 | | Weekly Target 3 | 17.04 | | Weekly Target 4 | 17.47 | | Weekly Target 5 | 18.11 |
Weekly price and volumes for Vandana
| Date |
Closing |
Open |
Range |
Volume |
Wed 03 September 2025 |
16.83 (-2.21%) |
16.90 |
16.61 - 17.68 |
0.2584 times |
Fri 29 August 2025 |
17.21 (-5.96%) |
18.50 |
16.05 - 18.74 |
0.4275 times |
Fri 22 August 2025 |
18.30 (-3.99%) |
19.20 |
17.01 - 19.77 |
0.5553 times |
Thu 14 August 2025 |
19.06 (-2.31%) |
19.89 |
17.55 - 20.10 |
0.7153 times |
Fri 08 August 2025 |
19.51 (6.61%) |
17.90 |
17.17 - 19.90 |
1.3861 times |
Fri 01 August 2025 |
18.30 (-0.92%) |
18.47 |
18.05 - 21.34 |
0.7771 times |
Fri 25 July 2025 |
18.47 (-15.43%) |
20.75 |
18.01 - 22.43 |
2.0624 times |
Fri 18 July 2025 |
21.84 (10.58%) |
18.80 |
18.54 - 22.22 |
2.3084 times |
Fri 11 July 2025 |
19.75 (-2.03%) |
20.56 |
19.75 - 21.34 |
1.0564 times |
Fri 04 July 2025 |
20.16 (10.28%) |
18.64 |
18.64 - 20.16 |
0.4531 times |
Fri 27 June 2025 |
18.28 (-0.11%) |
17.59 |
16.90 - 18.28 |
1.2806 times |
Monthly price and charts Vandana Strong monthly Stock price targets for Vandana 532090 are 16.19 and 17.26 | Monthly Target 1 | 15.97 | | Monthly Target 2 | 16.4 | | Monthly Target 3 | 17.04 | | Monthly Target 4 | 17.47 | | Monthly Target 5 | 18.11 |
Monthly price and volumes Vandana
| Date |
Closing |
Open |
Range |
Volume |
Wed 03 September 2025 |
16.83 (-2.21%) |
16.90 |
16.61 - 17.68 |
0.0548 times |
Fri 29 August 2025 |
17.21 (-8.99%) |
19.29 |
16.05 - 20.10 |
0.7053 times |
Thu 31 July 2025 |
18.91 (1.45%) |
19.01 |
18.01 - 22.43 |
1.3471 times |
Mon 30 June 2025 |
18.64 (9.84%) |
17.30 |
16.90 - 20.62 |
1.021 times |
Fri 30 May 2025 |
16.97 (3.92%) |
16.32 |
12.76 - 16.97 |
1.5622 times |
Wed 30 April 2025 |
16.33 (19.2%) |
13.43 |
13.17 - 17.68 |
0.6807 times |
Fri 28 March 2025 |
13.70 (23.76%) |
10.85 |
10.64 - 14.25 |
0.5716 times |
Fri 28 February 2025 |
11.07 (-2.89%) |
10.96 |
8.70 - 11.51 |
1.1702 times |
Fri 31 January 2025 |
11.40 (14.11%) |
10.18 |
10.18 - 13.60 |
2.0752 times |
Tue 31 December 2024 |
9.99 (43.74%) |
7.08 |
6.94 - 9.99 |
0.812 times |
Fri 29 November 2024 |
6.95 (46.01%) |
4.67 |
4.58 - 6.95 |
3.8227 times |

DMA SMA EMA moving averages of Vandana 532090
DMA (daily moving average) of Vandana 532090
| DMA period | DMA value | | 5 day DMA | 17.17 | | 12 day DMA | 17.91 | | 20 day DMA | 18.3 | | 35 day DMA | 18.94 | | 50 day DMA | 19.05 | | 100 day DMA | 17.8 | | 150 day DMA | 15.75 | | 200 day DMA | 13.86 | EMA (exponential moving average) of Vandana 532090
| EMA period | EMA current | EMA prev | EMA prev2 | | 5 day EMA | 17.19 | 17.37 | 17.51 | | 12 day EMA | 17.73 | 17.89 | 18.03 | | 20 day EMA | 18.1 | 18.23 | 18.35 | | 35 day EMA | 18.5 | 18.6 | 18.69 | | 50 day EMA | 18.82 | 18.9 | 18.97 |
SMA (simple moving average) of Vandana 532090
| SMA period | SMA current | SMA prev | SMA prev2 | | 5 day SMA | 17.17 | 17.34 | 17.52 | | 12 day SMA | 17.91 | 18.1 | 18.2 | | 20 day SMA | 18.3 | 18.33 | 18.39 | | 35 day SMA | 18.94 | 19.02 | 19.09 | | 50 day SMA | 19.05 | 19.06 | 19.09 | | 100 day SMA | 17.8 | 17.77 | 17.74 | | 150 day SMA | 15.75 | 15.72 | 15.69 | | 200 day SMA | 13.86 | 13.8 | 13.74 |
|
|
