WallfortFin 532053 full analysis,charts,indicators,moving averages,SMA,DMA,EMA,ADX,MACD,RSIWallfort Fin 532053 WideScreen charts, DMA,SMA,EMA technical analysis, forecast prediction, by indicators ADX,MACD,RSI,CCI BSE stock exchange
Daily price and charts and targets WallfortFin Strong Daily Stock price targets for WallfortFin 532053 are 81.62 and 86.62 | Daily Target 1 | 80.74 | | Daily Target 2 | 82.49 | | Daily Target 3 | 85.743333333333 | | Daily Target 4 | 87.49 | | Daily Target 5 | 90.74 |
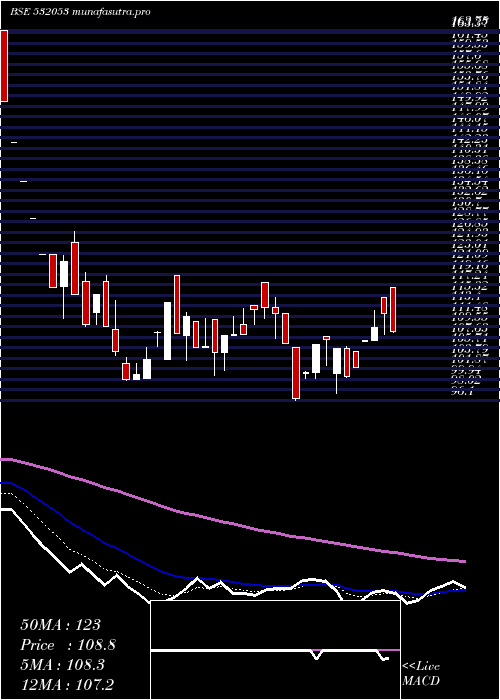
Daily price and volume Wallfort Fin
| Date |
Closing |
Open |
Range |
Volume |
Fri 05 December 2025 |
84.23 (1.86%) |
89.00 |
84.00 - 89.00 |
1.0352 times |
Thu 04 December 2025 |
82.69 (-1.99%) |
84.37 |
82.60 - 89.97 |
2.1234 times |
Wed 03 December 2025 |
84.37 (-3.01%) |
90.90 |
83.00 - 90.90 |
0.1226 times |
Tue 02 December 2025 |
86.99 (-3.36%) |
90.01 |
86.00 - 92.00 |
0.3274 times |
Mon 01 December 2025 |
90.01 (-1.2%) |
91.15 |
87.52 - 91.15 |
0.4068 times |
Fri 28 November 2025 |
91.10 (0.33%) |
93.55 |
88.10 - 93.55 |
0.8165 times |
Thu 27 November 2025 |
90.80 (3.83%) |
91.00 |
85.25 - 96.95 |
1.9024 times |
Wed 26 November 2025 |
87.45 (1.16%) |
86.00 |
85.05 - 89.95 |
1.1071 times |
Tue 25 November 2025 |
86.45 (-3.19%) |
90.00 |
86.10 - 94.80 |
0.9253 times |
Mon 24 November 2025 |
89.30 (-5.95%) |
92.20 |
88.50 - 95.95 |
1.2332 times |
Fri 21 November 2025 |
94.95 (-1.5%) |
96.80 |
87.05 - 96.80 |
0.2756 times |
Weekly price and charts WallfortFin Strong weekly Stock price targets for WallfortFin 532053 are 78.72 and 88.12 | Weekly Target 1 | 76.88 | | Weekly Target 2 | 80.55 | | Weekly Target 3 | 86.276666666667 | | Weekly Target 4 | 89.95 | | Weekly Target 5 | 95.68 |
Weekly price and volumes for Wallfort Fin
| Date |
Closing |
Open |
Range |
Volume |
Fri 05 December 2025 |
84.23 (-7.54%) |
91.15 |
82.60 - 92.00 |
0.8198 times |
Fri 28 November 2025 |
91.10 (-4.05%) |
92.20 |
85.05 - 96.95 |
1.2218 times |
Fri 21 November 2025 |
94.95 (-1.25%) |
97.80 |
86.25 - 106.00 |
0.6771 times |
Fri 14 November 2025 |
96.15 (-10.22%) |
108.05 |
95.00 - 113.00 |
3.5565 times |
Fri 07 November 2025 |
107.10 (-2.64%) |
110.00 |
104.00 - 119.80 |
0.7363 times |
Fri 31 October 2025 |
110.00 (-0.72%) |
110.00 |
106.60 - 118.00 |
0.4658 times |
Thu 23 October 2025 |
110.80 (5.83%) |
105.00 |
102.50 - 120.00 |
0.3551 times |
Fri 17 October 2025 |
104.70 (-2.33%) |
107.20 |
104.00 - 119.95 |
0.6541 times |
Fri 10 October 2025 |
107.20 (-1.7%) |
109.05 |
105.00 - 114.00 |
0.6082 times |
Fri 03 October 2025 |
109.05 (-4.34%) |
113.95 |
106.60 - 115.00 |
0.9053 times |
Fri 26 September 2025 |
114.00 (0.84%) |
114.10 |
108.00 - 120.00 |
1.1438 times |

Monthly price and charts WallfortFin Strong monthly Stock price targets for WallfortFin 532053 are 78.72 and 88.12 | Monthly Target 1 | 76.88 | | Monthly Target 2 | 80.55 | | Monthly Target 3 | 86.276666666667 | | Monthly Target 4 | 89.95 | | Monthly Target 5 | 95.68 |
Monthly price and volumes Wallfort Fin
| Date |
Closing |
Open |
Range |
Volume |
Fri 05 December 2025 |
84.23 (-7.54%) |
91.15 |
82.60 - 92.00 |
0.0844 times |
Fri 28 November 2025 |
91.10 (-17.18%) |
110.00 |
85.05 - 119.80 |
0.6374 times |
Fri 31 October 2025 |
110.00 (1.24%) |
108.65 |
102.50 - 120.00 |
0.2522 times |
Tue 30 September 2025 |
108.65 (-6.46%) |
124.00 |
106.60 - 137.90 |
0.4813 times |
Fri 29 August 2025 |
116.15 (0.09%) |
116.05 |
111.10 - 135.00 |
0.627 times |
Thu 31 July 2025 |
116.05 (-1.94%) |
123.20 |
110.70 - 129.85 |
0.494 times |
Mon 30 June 2025 |
118.35 (-0.67%) |
113.20 |
100.05 - 118.50 |
5.6374 times |
Fri 30 May 2025 |
119.15 (11.01%) |
104.65 |
102.35 - 132.50 |
0.5181 times |
Wed 30 April 2025 |
107.33 (11.28%) |
100.89 |
97.25 - 116.70 |
0.4374 times |
Fri 28 March 2025 |
96.45 (-8.14%) |
102.90 |
96.10 - 119.00 |
0.8309 times |
Fri 28 February 2025 |
105.00 (-37.8%) |
163.90 |
104.20 - 171.95 |
0.9631 times |

DMA SMA EMA moving averages of Wallfort Fin 532053
DMA (daily moving average) of Wallfort Fin 532053
| DMA period | DMA value | | 5 day DMA | 85.66 | | 12 day DMA | 88.73 | | 20 day DMA | 93.73 | | 35 day DMA | 100.45 | | 50 day DMA | 103.34 | | 100 day DMA | 111.02 | | 150 day DMA | 111.91 | | 200 day DMA | 113.35 | EMA (exponential moving average) of Wallfort Fin 532053
| EMA period | EMA current | EMA prev | EMA prev2 | | 5 day EMA | 85.4 | 85.98 | 87.63 | | 12 day EMA | 89 | 89.87 | 91.17 | | 20 day EMA | 92.74 | 93.63 | 94.78 | | 35 day EMA | 97.55 | 98.33 | 99.25 | | 50 day EMA | 102.55 | 103.3 | 104.14 |
SMA (simple moving average) of Wallfort Fin 532053
| SMA period | SMA current | SMA prev | SMA prev2 | | 5 day SMA | 85.66 | 87.03 | 88.65 | | 12 day SMA | 88.73 | 89.51 | 90.38 | | 20 day SMA | 93.73 | 94.92 | 96.38 | | 35 day SMA | 100.45 | 101.19 | 101.89 | | 50 day SMA | 103.34 | 103.92 | 104.56 | | 100 day SMA | 111.02 | 111.35 | 111.64 | | 150 day SMA | 111.91 | 112.09 | 112.26 | | 200 day SMA | 113.35 | 113.73 | 114.17 |
|
|
