SamIndus 532005 full analysis,charts,indicators,moving averages,SMA,DMA,EMA,ADX,MACD,RSISam Indus 532005 WideScreen charts, DMA,SMA,EMA technical analysis, forecast prediction, by indicators ADX,MACD,RSI,CCI BSE stock exchange
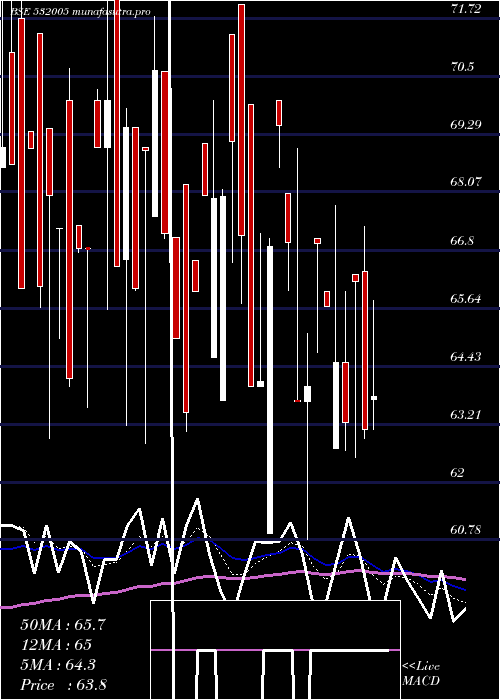
Daily price and charts and targets SamIndus Strong Daily Stock price targets for SamIndus 532005 are 57.6 and 66.45 | Daily Target 1 | 50.88 | | Daily Target 2 | 55.47 | | Daily Target 3 | 59.733333333333 | | Daily Target 4 | 64.32 | | Daily Target 5 | 68.58 |
Daily price and volume Sam Indus
| Date |
Closing |
Open |
Range |
Volume |
Thu 23 October 2025 |
60.05 (-1.44%) |
55.15 |
55.15 - 64.00 |
0.6066 times |
Mon 20 October 2025 |
60.93 (4.14%) |
65.20 |
60.80 - 65.20 |
0.4153 times |
Fri 17 October 2025 |
58.51 (-2.48%) |
58.50 |
58.50 - 63.40 |
5.4246 times |
Thu 16 October 2025 |
60.00 (0%) |
61.00 |
60.00 - 61.00 |
0.0263 times |
Wed 15 October 2025 |
60.00 (-2.91%) |
62.00 |
60.00 - 62.00 |
0.1438 times |
Tue 14 October 2025 |
61.80 (3%) |
55.70 |
55.70 - 61.80 |
0.2339 times |
Mon 13 October 2025 |
60.00 (0.02%) |
60.00 |
59.50 - 63.60 |
0.2627 times |
Fri 10 October 2025 |
59.99 (1.37%) |
64.00 |
59.00 - 64.00 |
0.1801 times |
Thu 09 October 2025 |
59.18 (0.05%) |
64.00 |
59.00 - 64.00 |
0.3765 times |
Wed 08 October 2025 |
59.15 (-3.63%) |
56.80 |
55.05 - 65.00 |
2.3302 times |
Tue 07 October 2025 |
61.38 (7.5%) |
59.00 |
58.00 - 61.53 |
2.3014 times |
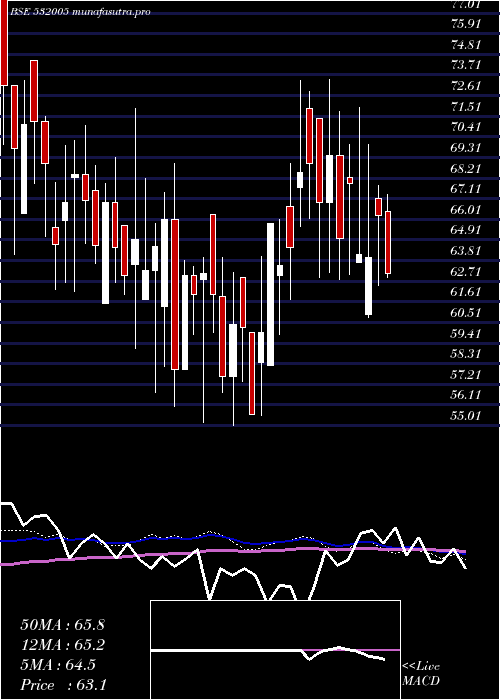
Weekly price and charts SamIndus Strong weekly Stock price targets for SamIndus 532005 are 52.58 and 62.63 | Weekly Target 1 | 50.08 | | Weekly Target 2 | 55.07 | | Weekly Target 3 | 60.133333333333 | | Weekly Target 4 | 65.12 | | Weekly Target 5 | 70.18 |
Weekly price and volumes for Sam Indus
| Date |
Closing |
Open |
Range |
Volume |
Thu 23 October 2025 |
60.05 (2.63%) |
65.20 |
55.15 - 65.20 |
0.2901 times |
Fri 17 October 2025 |
58.51 (-2.47%) |
60.00 |
55.70 - 63.60 |
1.729 times |
Fri 10 October 2025 |
59.99 (-1.46%) |
60.90 |
55.05 - 65.00 |
2.2416 times |
Fri 03 October 2025 |
60.88 (4.98%) |
58.00 |
55.50 - 61.00 |
0.2918 times |
Fri 26 September 2025 |
57.99 (-8.39%) |
57.00 |
55.00 - 65.70 |
2.0634 times |
Fri 19 September 2025 |
63.30 (5.41%) |
60.05 |
56.80 - 67.90 |
1.3132 times |
Fri 12 September 2025 |
60.05 (-1.38%) |
60.75 |
56.11 - 62.50 |
0.2751 times |
Fri 05 September 2025 |
60.89 (2.84%) |
62.99 |
59.70 - 64.40 |
0.7715 times |
Fri 29 August 2025 |
59.21 (-7.8%) |
62.20 |
58.20 - 68.50 |
0.6657 times |
Fri 22 August 2025 |
64.22 (1.94%) |
63.00 |
57.55 - 68.70 |
0.3586 times |
Thu 14 August 2025 |
63.00 (4.65%) |
59.59 |
55.10 - 65.90 |
0.5155 times |
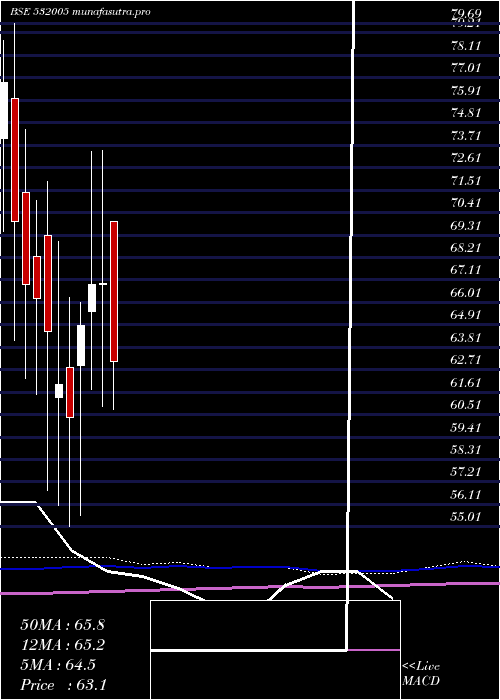
Monthly price and charts SamIndus Strong monthly Stock price targets for SamIndus 532005 are 52.48 and 62.63 | Monthly Target 1 | 49.95 | | Monthly Target 2 | 55 | | Monthly Target 3 | 60.1 | | Monthly Target 4 | 65.15 | | Monthly Target 5 | 70.25 |
Monthly price and volumes Sam Indus
| Date |
Closing |
Open |
Range |
Volume |
Thu 23 October 2025 |
60.05 (0.12%) |
61.00 |
55.05 - 65.20 |
1.1677 times |
Tue 30 September 2025 |
59.98 (1.3%) |
62.99 |
55.00 - 67.90 |
1.2713 times |
Fri 29 August 2025 |
59.21 (-2.85%) |
62.00 |
55.10 - 68.70 |
0.9708 times |
Thu 31 July 2025 |
60.95 (-8.95%) |
69.99 |
60.71 - 69.99 |
0.7216 times |
Mon 30 June 2025 |
66.94 (0.06%) |
66.90 |
60.91 - 73.48 |
1.0214 times |
Fri 30 May 2025 |
66.90 (3.08%) |
65.54 |
61.73 - 73.40 |
1.2711 times |
Tue 29 April 2025 |
64.90 (7.49%) |
62.90 |
55.55 - 66.00 |
0.2921 times |
Fri 28 March 2025 |
60.38 (-2.61%) |
62.80 |
55.01 - 66.25 |
0.9247 times |
Fri 28 February 2025 |
62.00 (-3.98%) |
61.35 |
56.05 - 69.00 |
0.7829 times |
Fri 31 January 2025 |
64.57 (-2.45%) |
69.30 |
56.80 - 71.93 |
1.5765 times |
Tue 31 December 2024 |
66.19 (-1.06%) |
68.24 |
61.50 - 71.00 |
1.197 times |
DMA SMA EMA moving averages of Sam Indus 532005
DMA (daily moving average) of Sam Indus 532005
| DMA period | DMA value | | 5 day DMA | 59.9 | | 12 day DMA | 59.84 | | 20 day DMA | 59.67 | | 35 day DMA | 60.37 | | 50 day DMA | 60.96 | | 100 day DMA | 63.38 | | 150 day DMA | 63.16 | | 200 day DMA | 63.39 | EMA (exponential moving average) of Sam Indus 532005
| EMA period | EMA current | EMA prev | EMA prev2 | | 5 day EMA | 60.06 | 60.06 | 59.63 | | 12 day EMA | 60.01 | 60 | 59.83 | | 20 day EMA | 60.09 | 60.09 | 60 | | 35 day EMA | 60.46 | 60.48 | 60.45 | | 50 day EMA | 60.96 | 61 | 61 |
SMA (simple moving average) of Sam Indus 532005
| SMA period | SMA current | SMA prev | SMA prev2 | | 5 day SMA | 59.9 | 60.25 | 60.06 | | 12 day SMA | 59.84 | 59.91 | 59.83 | | 20 day SMA | 59.67 | 59.83 | 59.89 | | 35 day SMA | 60.37 | 60.35 | 60.45 | | 50 day SMA | 60.96 | 61.02 | 61.02 | | 100 day SMA | 63.38 | 63.47 | 63.52 | | 150 day SMA | 63.16 | 63.17 | 63.16 | | 200 day SMA | 63.39 | 63.42 | 63.46 |
|
|
