OdysseyCorp 531996 full analysis,charts,indicators,moving averages,SMA,DMA,EMA,ADX,MACD,RSIOdyssey Corp 531996 WideScreen charts, DMA,SMA,EMA technical analysis, forecast prediction, by indicators ADX,MACD,RSI,CCI BSE stock exchange
Daily price and charts and targets OdysseyCorp Strong Daily Stock price targets for OdysseyCorp 531996 are 8.01 and 8.43 | Daily Target 1 | 7.7 | | Daily Target 2 | 7.9 | | Daily Target 3 | 8.1166666666667 | | Daily Target 4 | 8.32 | | Daily Target 5 | 8.54 |
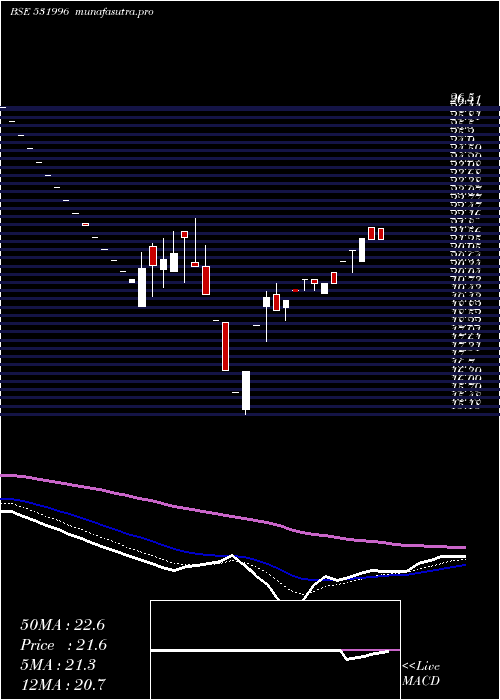
Daily price and volume Odyssey Corp
| Date |
Closing |
Open |
Range |
Volume |
Fri 05 December 2025 |
8.11 (0.25%) |
7.91 |
7.91 - 8.33 |
0.4396 times |
Thu 04 December 2025 |
8.09 (-2.29%) |
8.03 |
8.01 - 8.52 |
0.3105 times |
Wed 03 December 2025 |
8.28 (-0.96%) |
8.31 |
8.10 - 8.70 |
0.1295 times |
Tue 02 December 2025 |
8.36 (4.5%) |
8.00 |
7.87 - 8.45 |
0.7962 times |
Mon 01 December 2025 |
8.00 (-1.6%) |
8.58 |
7.51 - 8.58 |
0.9784 times |
Fri 28 November 2025 |
8.13 (0.99%) |
8.21 |
8.00 - 8.39 |
3.3564 times |
Thu 27 November 2025 |
8.05 (-3.71%) |
8.49 |
8.01 - 8.49 |
0.2641 times |
Wed 26 November 2025 |
8.36 (4.37%) |
8.21 |
8.02 - 8.50 |
0.3755 times |
Tue 25 November 2025 |
8.01 (0%) |
8.01 |
7.91 - 8.39 |
0.483 times |
Mon 24 November 2025 |
8.01 (-0.74%) |
8.07 |
7.71 - 8.24 |
2.8668 times |
Fri 21 November 2025 |
8.07 (-2.77%) |
8.40 |
8.01 - 8.40 |
0.6329 times |
Weekly price and charts OdysseyCorp Strong weekly Stock price targets for OdysseyCorp 531996 are 7.22 and 8.41 | Weekly Target 1 | 6.92 | | Weekly Target 2 | 7.51 | | Weekly Target 3 | 8.1066666666667 | | Weekly Target 4 | 8.7 | | Weekly Target 5 | 9.3 |
Weekly price and volumes for Odyssey Corp
| Date |
Closing |
Open |
Range |
Volume |
Fri 05 December 2025 |
8.11 (-0.25%) |
8.58 |
7.51 - 8.70 |
0.5826 times |
Fri 28 November 2025 |
8.13 (0.74%) |
8.07 |
7.71 - 8.50 |
1.6124 times |
Fri 21 November 2025 |
8.07 (0.37%) |
8.20 |
8.01 - 8.69 |
1.2046 times |
Fri 14 November 2025 |
8.04 (1.13%) |
7.91 |
7.50 - 8.60 |
1.0525 times |
Fri 07 November 2025 |
7.95 (-2.57%) |
8.45 |
7.71 - 8.82 |
1.9327 times |
Fri 31 October 2025 |
8.16 (-0.12%) |
8.85 |
7.96 - 8.97 |
1.8774 times |
Thu 23 October 2025 |
8.17 (1.24%) |
8.40 |
7.61 - 8.75 |
0.2654 times |
Fri 17 October 2025 |
8.07 (-12.66%) |
9.41 |
7.66 - 9.76 |
0.5293 times |
Fri 10 October 2025 |
9.24 (-4.45%) |
9.20 |
8.67 - 10.14 |
0.8039 times |
Fri 03 October 2025 |
9.67 (-3.88%) |
10.30 |
9.43 - 10.35 |
0.1392 times |
Fri 26 September 2025 |
10.06 (0.9%) |
10.00 |
9.49 - 10.39 |
0.2517 times |

Monthly price and charts OdysseyCorp Strong monthly Stock price targets for OdysseyCorp 531996 are 7.22 and 8.41 | Monthly Target 1 | 6.92 | | Monthly Target 2 | 7.51 | | Monthly Target 3 | 8.1066666666667 | | Monthly Target 4 | 8.7 | | Monthly Target 5 | 9.3 |
Monthly price and volumes Odyssey Corp
| Date |
Closing |
Open |
Range |
Volume |
Fri 05 December 2025 |
8.11 (-0.25%) |
8.58 |
7.51 - 8.70 |
0.1734 times |
Fri 28 November 2025 |
8.13 (-0.37%) |
8.45 |
7.50 - 8.82 |
1.7272 times |
Fri 31 October 2025 |
8.16 (-17.58%) |
10.35 |
7.61 - 10.35 |
1.0599 times |
Tue 30 September 2025 |
9.90 (2.91%) |
9.86 |
9.08 - 10.74 |
0.7847 times |
Fri 29 August 2025 |
9.62 (-23.77%) |
12.65 |
8.41 - 12.97 |
1.8781 times |
Thu 31 July 2025 |
12.62 (-8.88%) |
13.58 |
11.19 - 14.25 |
0.4186 times |
Mon 30 June 2025 |
13.85 (32.54%) |
9.93 |
9.93 - 15.14 |
2.0086 times |
Fri 30 May 2025 |
10.45 (-51.69%) |
21.63 |
10.45 - 21.63 |
1.3083 times |
Wed 30 April 2025 |
21.63 (28.67%) |
15.97 |
15.18 - 22.07 |
0.2743 times |
Fri 28 March 2025 |
16.81 (-29.93%) |
23.52 |
16.81 - 23.52 |
0.3669 times |
Fri 28 February 2025 |
23.99 (-7.87%) |
25.00 |
22.40 - 30.25 |
0.3 times |

DMA SMA EMA moving averages of Odyssey Corp 531996
DMA (daily moving average) of Odyssey Corp 531996
| DMA period | DMA value | | 5 day DMA | 8.17 | | 12 day DMA | 8.15 | | 20 day DMA | 8.11 | | 35 day DMA | 8.21 | | 50 day DMA | 8.66 | | 100 day DMA | 9.79 | | 150 day DMA | 11.59 | | 200 day DMA | 14.35 | EMA (exponential moving average) of Odyssey Corp 531996
| EMA period | EMA current | EMA prev | EMA prev2 | | 5 day EMA | 8.15 | 8.17 | 8.21 | | 12 day EMA | 8.15 | 8.16 | 8.17 | | 20 day EMA | 8.21 | 8.22 | 8.23 | | 35 day EMA | 8.46 | 8.48 | 8.5 | | 50 day EMA | 8.74 | 8.77 | 8.8 |
SMA (simple moving average) of Odyssey Corp 531996
| SMA period | SMA current | SMA prev | SMA prev2 | | 5 day SMA | 8.17 | 8.17 | 8.16 | | 12 day SMA | 8.15 | 8.14 | 8.14 | | 20 day SMA | 8.11 | 8.11 | 8.11 | | 35 day SMA | 8.21 | 8.23 | 8.27 | | 50 day SMA | 8.66 | 8.7 | 8.74 | | 100 day SMA | 9.79 | 9.85 | 9.91 | | 150 day SMA | 11.59 | 11.68 | 11.77 | | 200 day SMA | 14.35 | 14.43 | 14.52 |
|
|
