AmbikaCotto 531978 full analysis,charts,indicators,moving averages,SMA,DMA,EMA,ADX,MACD,RSIAmbika Cotto 531978 WideScreen charts, DMA,SMA,EMA technical analysis, forecast prediction, by indicators ADX,MACD,RSI,CCI BSE stock exchange
Daily price and charts and targets AmbikaCotto Strong Daily Stock price targets for AmbikaCotto 531978 are 1358.7 and 1415.7 | Daily Target 1 | 1346.23 | | Daily Target 2 | 1371.17 | | Daily Target 3 | 1403.2333333333 | | Daily Target 4 | 1428.17 | | Daily Target 5 | 1460.23 |
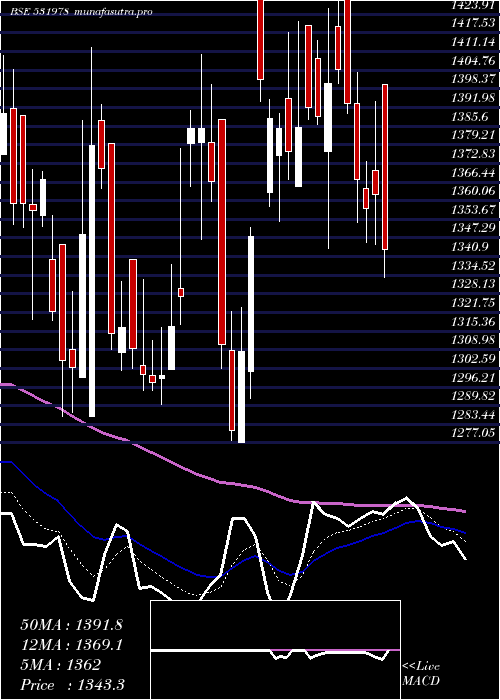
Daily price and volume Ambika Cotto
| Date |
Closing |
Open |
Range |
Volume |
Thu 23 October 2025 |
1396.10 (0.86%) |
1409.40 |
1378.30 - 1435.30 |
2.9048 times |
Tue 21 October 2025 |
1384.20 (1.41%) |
1380.00 |
1361.00 - 1397.60 |
0.2882 times |
Mon 20 October 2025 |
1364.90 (0.66%) |
1368.60 |
1356.75 - 1390.40 |
1.7095 times |
Fri 17 October 2025 |
1356.00 (-1.85%) |
1386.70 |
1343.10 - 1386.70 |
1.0144 times |
Thu 16 October 2025 |
1381.60 (0.19%) |
1390.30 |
1377.00 - 1391.00 |
0.6075 times |
Wed 15 October 2025 |
1379.00 (-0.68%) |
1388.90 |
1377.00 - 1390.40 |
1.1359 times |
Tue 14 October 2025 |
1388.45 (-0.26%) |
1365.65 |
1365.65 - 1402.65 |
0.4097 times |
Mon 13 October 2025 |
1392.00 (-1.28%) |
1402.00 |
1391.65 - 1403.65 |
0.4069 times |
Fri 10 October 2025 |
1410.00 (0.42%) |
1402.00 |
1402.00 - 1415.00 |
0.4973 times |
Thu 09 October 2025 |
1404.05 (-0.31%) |
1350.20 |
1350.20 - 1413.15 |
1.0257 times |
Wed 08 October 2025 |
1408.40 (0.26%) |
1407.00 |
1400.90 - 1412.00 |
0.1837 times |
Weekly price and charts AmbikaCotto Strong weekly Stock price targets for AmbikaCotto 531978 are 1376.43 and 1454.98 | Weekly Target 1 | 1317.5 | | Weekly Target 2 | 1356.8 | | Weekly Target 3 | 1396.05 | | Weekly Target 4 | 1435.35 | | Weekly Target 5 | 1474.6 |
Weekly price and volumes for Ambika Cotto
| Date |
Closing |
Open |
Range |
Volume |
Thu 23 October 2025 |
1396.10 (2.96%) |
1368.60 |
1356.75 - 1435.30 |
0.3777 times |
Fri 17 October 2025 |
1356.00 (-3.83%) |
1402.00 |
1343.10 - 1403.65 |
0.2754 times |
Fri 10 October 2025 |
1410.00 (-1.42%) |
1423.30 |
1350.20 - 1425.45 |
0.2985 times |
Fri 03 October 2025 |
1430.25 (0.68%) |
1341.35 |
1341.35 - 1450.05 |
0.2673 times |
Fri 26 September 2025 |
1420.65 (-6.32%) |
1500.00 |
1410.00 - 1517.55 |
1.6371 times |
Fri 19 September 2025 |
1516.50 (0.46%) |
1530.45 |
1507.10 - 1569.00 |
1.8561 times |
Fri 12 September 2025 |
1509.50 (2.68%) |
1441.15 |
1441.15 - 1525.25 |
1.1214 times |
Fri 05 September 2025 |
1470.15 (4.13%) |
1407.70 |
1394.10 - 1505.50 |
0.9139 times |
Fri 29 August 2025 |
1411.80 (-4.35%) |
1505.00 |
1376.00 - 1505.00 |
1.1347 times |
Fri 22 August 2025 |
1476.00 (4.76%) |
1421.70 |
1417.95 - 1568.95 |
2.1178 times |
Thu 14 August 2025 |
1409.00 (1.4%) |
1389.55 |
1380.00 - 1449.60 |
0.8029 times |

Monthly price and charts AmbikaCotto Strong monthly Stock price targets for AmbikaCotto 531978 are 1316.13 and 1423.08 | Monthly Target 1 | 1289.47 | | Monthly Target 2 | 1342.78 | | Monthly Target 3 | 1396.4166666667 | | Monthly Target 4 | 1449.73 | | Monthly Target 5 | 1503.37 |
Monthly price and volumes Ambika Cotto
| Date |
Closing |
Open |
Range |
Volume |
Thu 23 October 2025 |
1396.10 (-1.46%) |
1413.70 |
1343.10 - 1450.05 |
0.1828 times |
Tue 30 September 2025 |
1416.85 (0.36%) |
1407.70 |
1341.35 - 1569.00 |
1.0051 times |
Fri 29 August 2025 |
1411.80 (-9.93%) |
1564.00 |
1376.00 - 1568.95 |
1.1486 times |
Thu 31 July 2025 |
1567.50 (-0.88%) |
1594.95 |
1555.05 - 1675.00 |
0.8256 times |
Mon 30 June 2025 |
1581.45 (5.89%) |
1484.25 |
1464.20 - 1700.00 |
0.9145 times |
Fri 30 May 2025 |
1493.45 (11.18%) |
1360.95 |
1318.05 - 1598.95 |
0.7195 times |
Wed 30 April 2025 |
1343.25 (4.86%) |
1277.05 |
1277.05 - 1460.00 |
0.882 times |
Fri 28 March 2025 |
1281.05 (-3.09%) |
1345.00 |
1278.00 - 1412.55 |
1.6925 times |
Fri 28 February 2025 |
1321.95 (-13.22%) |
1490.00 |
1319.00 - 1533.00 |
1.3849 times |
Fri 31 January 2025 |
1523.25 (-5.65%) |
1699.95 |
1425.00 - 1770.00 |
1.2446 times |
Tue 31 December 2024 |
1614.55 (7.05%) |
1512.40 |
1505.25 - 1824.00 |
1.5316 times |

DMA SMA EMA moving averages of Ambika Cotto 531978
DMA (daily moving average) of Ambika Cotto 531978
| DMA period | DMA value | | 5 day DMA | 1376.56 | | 12 day DMA | 1389.12 | | 20 day DMA | 1407.73 | | 35 day DMA | 1446.22 | | 50 day DMA | 1443.42 | | 100 day DMA | 1508.61 | | 150 day DMA | 1473.05 | | 200 day DMA | 1477.94 | EMA (exponential moving average) of Ambika Cotto 531978
| EMA period | EMA current | EMA prev | EMA prev2 | | 5 day EMA | 1383.45 | 1377.13 | 1373.59 | | 12 day EMA | 1392.74 | 1392.13 | 1393.57 | | 20 day EMA | 1407.39 | 1408.58 | 1411.15 | | 35 day EMA | 1420.99 | 1422.46 | 1424.71 | | 50 day EMA | 1438.52 | 1440.25 | 1442.54 |
SMA (simple moving average) of Ambika Cotto 531978
| SMA period | SMA current | SMA prev | SMA prev2 | | 5 day SMA | 1376.56 | 1373.14 | 1373.99 | | 12 day SMA | 1389.12 | 1390.55 | 1394.38 | | 20 day SMA | 1407.73 | 1411.18 | 1415.82 | | 35 day SMA | 1446.22 | 1447.05 | 1447.71 | | 50 day SMA | 1443.42 | 1443.29 | 1444.8 | | 100 day SMA | 1508.61 | 1509.89 | 1511.09 | | 150 day SMA | 1473.05 | 1472.94 | 1472.7 | | 200 day SMA | 1477.94 | 1479.22 | 1480.38 |
|
|
