Newinfra 531959 full analysis,charts,indicators,moving averages,SMA,DMA,EMA,ADX,MACD,RSINewinfra 531959 WideScreen charts, DMA,SMA,EMA technical analysis, forecast prediction, by indicators ADX,MACD,RSI,CCI BSE stock exchange
Daily price and charts and targets Newinfra Strong Daily Stock price targets for Newinfra 531959 are 2.08 and 2.17 | Daily Target 1 | 2.02 | | Daily Target 2 | 2.05 | | Daily Target 3 | 2.1066666666667 | | Daily Target 4 | 2.14 | | Daily Target 5 | 2.2 |
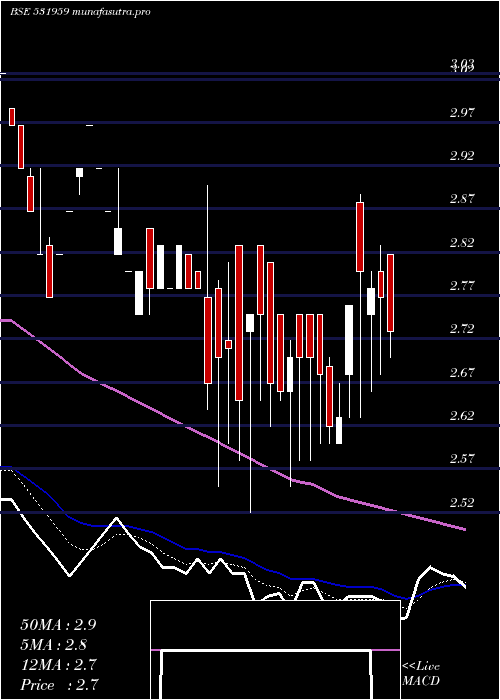
Daily price and volume Newinfra
| Date |
Closing |
Open |
Range |
Volume |
Wed 03 September 2025 |
2.09 (0.48%) |
2.07 |
2.07 - 2.16 |
1.5432 times |
Tue 02 September 2025 |
2.08 (0.48%) |
2.07 |
2.06 - 2.14 |
0.7716 times |
Mon 01 September 2025 |
2.07 (0.49%) |
2.09 |
2.00 - 2.17 |
0.8003 times |
Fri 29 August 2025 |
2.06 (-0.48%) |
2.08 |
2.04 - 2.09 |
0.3959 times |
Thu 28 August 2025 |
2.07 (-0.96%) |
2.09 |
2.04 - 2.13 |
0.945 times |
Tue 26 August 2025 |
2.09 (0.48%) |
2.07 |
2.04 - 2.13 |
0.6155 times |
Mon 25 August 2025 |
2.08 (-0.48%) |
2.13 |
2.03 - 2.17 |
0.6905 times |
Fri 22 August 2025 |
2.09 (0%) |
2.14 |
2.09 - 2.37 |
1.4411 times |
Thu 21 August 2025 |
2.09 (-0.48%) |
2.14 |
2.03 - 2.14 |
0.645 times |
Wed 20 August 2025 |
2.10 (-3.67%) |
2.25 |
2.03 - 2.35 |
2.1517 times |
Tue 19 August 2025 |
2.18 (-17.11%) |
2.69 |
2.11 - 2.69 |
5.6218 times |
Weekly price and charts Newinfra Strong weekly Stock price targets for Newinfra 531959 are 2.01 and 2.18 | Weekly Target 1 | 1.92 | | Weekly Target 2 | 2 | | Weekly Target 3 | 2.0866666666667 | | Weekly Target 4 | 2.17 | | Weekly Target 5 | 2.26 |
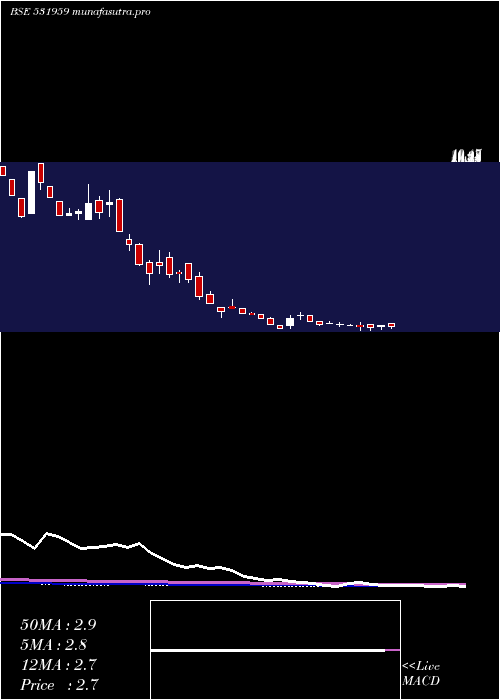
Weekly price and volumes for Newinfra
| Date |
Closing |
Open |
Range |
Volume |
Wed 03 September 2025 |
2.09 (1.46%) |
2.09 |
2.00 - 2.17 |
0.9454 times |
Fri 29 August 2025 |
2.06 (-1.44%) |
2.13 |
2.03 - 2.17 |
0.8033 times |
Fri 22 August 2025 |
2.09 (-17.06%) |
2.68 |
2.03 - 2.99 |
3.0938 times |
Thu 14 August 2025 |
2.52 (5.44%) |
2.44 |
2.36 - 2.59 |
0.4144 times |
Fri 08 August 2025 |
2.39 (-1.24%) |
2.38 |
2.30 - 2.66 |
0.6451 times |
Fri 01 August 2025 |
2.42 (-10.37%) |
2.84 |
2.35 - 2.84 |
0.6968 times |
Fri 25 July 2025 |
2.70 (-2.17%) |
2.82 |
2.62 - 2.95 |
0.8179 times |
Fri 18 July 2025 |
2.76 (0%) |
2.88 |
2.63 - 2.89 |
0.8502 times |
Fri 11 July 2025 |
2.76 (2.22%) |
2.75 |
2.58 - 2.76 |
0.949 times |
Fri 04 July 2025 |
2.70 (-1.82%) |
2.83 |
2.55 - 2.83 |
0.7842 times |
Fri 27 June 2025 |
2.75 (-1.08%) |
2.77 |
2.52 - 2.90 |
1.808 times |
Monthly price and charts Newinfra Strong monthly Stock price targets for Newinfra 531959 are 2.01 and 2.18 | Monthly Target 1 | 1.92 | | Monthly Target 2 | 2 | | Monthly Target 3 | 2.0866666666667 | | Monthly Target 4 | 2.17 | | Monthly Target 5 | 2.26 |
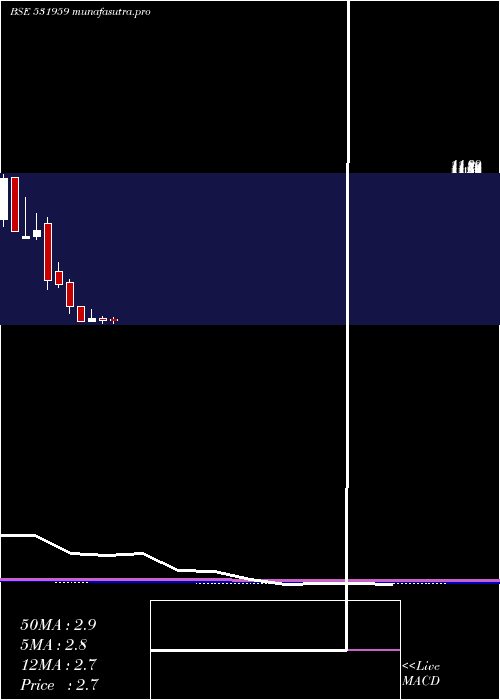
Monthly price and volumes Newinfra
| Date |
Closing |
Open |
Range |
Volume |
Wed 03 September 2025 |
2.09 (1.46%) |
2.09 |
2.00 - 2.17 |
0.2813 times |
Fri 29 August 2025 |
2.06 (-21.07%) |
2.66 |
2.03 - 2.99 |
1.5514 times |
Thu 31 July 2025 |
2.61 (-5.09%) |
2.81 |
2.55 - 2.95 |
1.0966 times |
Mon 30 June 2025 |
2.75 (-2.48%) |
2.87 |
2.52 - 2.97 |
1.2575 times |
Fri 30 May 2025 |
2.82 (5.22%) |
2.67 |
2.63 - 3.40 |
0.7097 times |
Wed 30 April 2025 |
2.68 (-25.76%) |
3.60 |
2.68 - 3.60 |
0.3794 times |
Fri 28 March 2025 |
3.61 (-27.22%) |
5.12 |
3.15 - 5.30 |
2.2597 times |
Fri 28 February 2025 |
4.96 (-5.52%) |
5.78 |
4.80 - 6.36 |
0.6883 times |
Fri 31 January 2025 |
5.25 (-37.43%) |
8.80 |
4.70 - 9.20 |
0.8733 times |
Tue 31 December 2024 |
8.39 (4.74%) |
8.01 |
7.79 - 9.45 |
0.9027 times |
Fri 29 November 2024 |
8.01 (-3.49%) |
7.90 |
7.89 - 10.47 |
0.5088 times |
DMA SMA EMA moving averages of Newinfra 531959
DMA (daily moving average) of Newinfra 531959
| DMA period | DMA value | | 5 day DMA | 2.07 | | 12 day DMA | 2.14 | | 20 day DMA | 2.27 | | 35 day DMA | 2.45 | | 50 day DMA | 2.52 | | 100 day DMA | 2.75 | | 150 day DMA | 3.45 | | 200 day DMA | 4.7 | EMA (exponential moving average) of Newinfra 531959
| EMA period | EMA current | EMA prev | EMA prev2 | | 5 day EMA | 2.08 | 2.08 | 2.08 | | 12 day EMA | 2.15 | 2.16 | 2.18 | | 20 day EMA | 2.24 | 2.26 | 2.28 | | 35 day EMA | 2.36 | 2.38 | 2.4 | | 50 day EMA | 2.49 | 2.51 | 2.53 |
SMA (simple moving average) of Newinfra 531959
| SMA period | SMA current | SMA prev | SMA prev2 | | 5 day SMA | 2.07 | 2.07 | 2.07 | | 12 day SMA | 2.14 | 2.17 | 2.21 | | 20 day SMA | 2.27 | 2.3 | 2.31 | | 35 day SMA | 2.45 | 2.47 | 2.49 | | 50 day SMA | 2.52 | 2.54 | 2.55 | | 100 day SMA | 2.75 | 2.76 | 2.78 | | 150 day SMA | 3.45 | 3.48 | 3.51 | | 200 day SMA | 4.7 | 4.73 | 4.76 |
|
|
