AgarInd 531921 full analysis,charts,indicators,moving averages,SMA,DMA,EMA,ADX,MACD,RSIAgar Ind 531921 WideScreen charts, DMA,SMA,EMA technical analysis, forecast prediction, by indicators ADX,MACD,RSI,CCI BSE stock exchange
Daily price and charts and targets AgarInd Strong Daily Stock price targets for AgarInd 531921 are 886.6 and 900.8 | Daily Target 1 | 883.48 | | Daily Target 2 | 889.72 | | Daily Target 3 | 897.68333333333 | | Daily Target 4 | 903.92 | | Daily Target 5 | 911.88 |
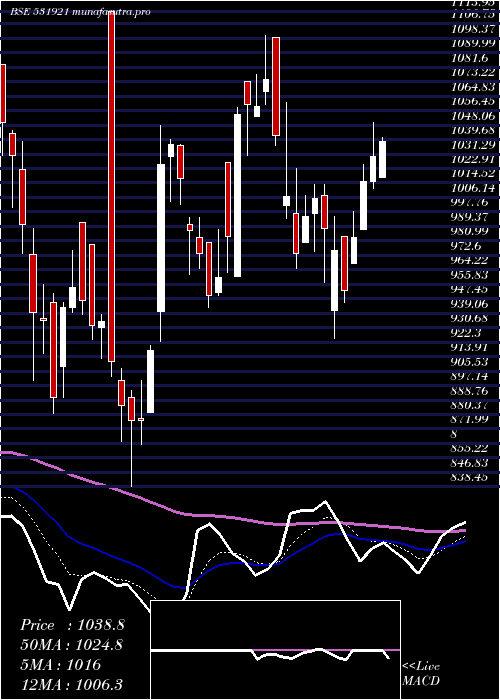
Daily price and volume Agar Ind
| Date |
Closing |
Open |
Range |
Volume |
Tue 21 October 2025 |
895.95 (0.98%) |
899.75 |
891.45 - 905.65 |
0.17 times |
Mon 20 October 2025 |
887.25 (0.34%) |
883.95 |
868.85 - 889.50 |
1.2598 times |
Fri 17 October 2025 |
884.20 (-0.2%) |
883.25 |
872.35 - 889.60 |
0.2925 times |
Thu 16 October 2025 |
886.00 (-1.32%) |
895.50 |
881.15 - 900.95 |
2.0396 times |
Wed 15 October 2025 |
897.85 (1.56%) |
886.05 |
876.05 - 902.25 |
0.6932 times |
Tue 14 October 2025 |
884.10 (-1.66%) |
892.45 |
880.20 - 903.70 |
0.7849 times |
Mon 13 October 2025 |
899.05 (0.43%) |
894.20 |
889.15 - 905.70 |
0.5902 times |
Fri 10 October 2025 |
895.20 (-0.41%) |
900.00 |
891.65 - 903.75 |
0.6335 times |
Thu 09 October 2025 |
898.90 (-0.26%) |
890.05 |
882.20 - 902.35 |
1.3494 times |
Wed 08 October 2025 |
901.20 (-1.4%) |
901.55 |
893.00 - 915.50 |
2.1869 times |
Tue 07 October 2025 |
914.00 (-1.32%) |
928.05 |
905.00 - 931.35 |
0.7468 times |
Weekly price and charts AgarInd Strong weekly Stock price targets for AgarInd 531921 are 882.4 and 919.2 | Weekly Target 1 | 853.35 | | Weekly Target 2 | 874.65 | | Weekly Target 3 | 890.15 | | Weekly Target 4 | 911.45 | | Weekly Target 5 | 926.95 |
Weekly price and volumes for Agar Ind
| Date |
Closing |
Open |
Range |
Volume |
Tue 21 October 2025 |
895.95 (1.33%) |
883.95 |
868.85 - 905.65 |
0.0756 times |
Fri 17 October 2025 |
884.20 (-1.23%) |
894.20 |
872.35 - 905.70 |
0.2328 times |
Fri 10 October 2025 |
895.20 (-5.25%) |
926.50 |
882.20 - 945.05 |
0.3108 times |
Fri 03 October 2025 |
944.80 (1.7%) |
902.05 |
900.05 - 958.45 |
0.3659 times |
Fri 26 September 2025 |
929.05 (-6.16%) |
985.10 |
924.10 - 1002.65 |
0.9136 times |
Fri 19 September 2025 |
990.00 (4.66%) |
940.00 |
905.50 - 995.00 |
1.8309 times |
Fri 12 September 2025 |
945.95 (13.72%) |
811.15 |
811.15 - 952.00 |
1.2054 times |
Fri 05 September 2025 |
831.80 (6.12%) |
785.30 |
785.25 - 839.05 |
0.6007 times |
Fri 29 August 2025 |
783.80 (-2.34%) |
818.45 |
767.05 - 818.45 |
0.9923 times |
Fri 22 August 2025 |
802.55 (-14.6%) |
880.15 |
801.05 - 900.00 |
3.472 times |
Thu 14 August 2025 |
939.75 (-1.1%) |
950.25 |
933.85 - 958.00 |
0.2403 times |

Monthly price and charts AgarInd Strong monthly Stock price targets for AgarInd 531921 are 837.6 and 927.2 | Monthly Target 1 | 818.15 | | Monthly Target 2 | 857.05 | | Monthly Target 3 | 907.75 | | Monthly Target 4 | 946.65 | | Monthly Target 5 | 997.35 |
Monthly price and volumes Agar Ind
| Date |
Closing |
Open |
Range |
Volume |
Tue 21 October 2025 |
895.95 (-5.07%) |
950.00 |
868.85 - 958.45 |
0.2969 times |
Tue 30 September 2025 |
943.80 (20.41%) |
785.30 |
785.25 - 1002.65 |
1.8983 times |
Fri 29 August 2025 |
783.80 (-20.15%) |
984.20 |
767.05 - 989.20 |
2.0789 times |
Thu 31 July 2025 |
981.60 (-1.52%) |
991.40 |
905.05 - 993.50 |
0.7789 times |
Mon 30 June 2025 |
996.80 (3.28%) |
977.95 |
935.20 - 1023.40 |
0.9389 times |
Fri 30 May 2025 |
965.15 (-1.61%) |
981.00 |
927.00 - 1083.10 |
1.0531 times |
Wed 30 April 2025 |
980.90 (0.74%) |
980.00 |
924.60 - 1080.00 |
0.5624 times |
Fri 28 March 2025 |
973.70 (9.98%) |
890.40 |
838.45 - 1099.75 |
0.8222 times |
Fri 28 February 2025 |
885.35 (-21.83%) |
1110.00 |
864.60 - 1132.85 |
0.9581 times |
Fri 31 January 2025 |
1132.55 (-11.83%) |
1291.40 |
1011.45 - 1314.95 |
0.6122 times |
Tue 31 December 2024 |
1284.55 (8.05%) |
1189.40 |
1166.55 - 1383.15 |
2.2439 times |

DMA SMA EMA moving averages of Agar Ind 531921
DMA (daily moving average) of Agar Ind 531921
| DMA period | DMA value | | 5 day DMA | 890.25 | | 12 day DMA | 897.49 | | 20 day DMA | 918.59 | | 35 day DMA | 907.7 | | 50 day DMA | 891.02 | | 100 day DMA | 926 | | 150 day DMA | 952.78 | | 200 day DMA | 990.14 | EMA (exponential moving average) of Agar Ind 531921
| EMA period | EMA current | EMA prev | EMA prev2 | | 5 day EMA | 891.65 | 889.5 | 890.63 | | 12 day EMA | 899.61 | 900.28 | 902.65 | | 20 day EMA | 905.32 | 906.31 | 908.32 | | 35 day EMA | 902.09 | 902.45 | 903.34 | | 50 day EMA | 896.37 | 896.39 | 896.76 |
SMA (simple moving average) of Agar Ind 531921
| SMA period | SMA current | SMA prev | SMA prev2 | | 5 day SMA | 890.25 | 887.88 | 890.24 | | 12 day SMA | 897.49 | 901.56 | 906.45 | | 20 day SMA | 918.59 | 921.7 | 926.84 | | 35 day SMA | 907.7 | 904.81 | 901.85 | | 50 day SMA | 891.02 | 892.06 | 893.65 | | 100 day SMA | 926 | 926.75 | 927.67 | | 150 day SMA | 952.78 | 952.92 | 952.85 | | 200 day SMA | 990.14 | 992.13 | 994.37 |
|
|
