HindApplian 531918 full analysis,charts,indicators,moving averages,SMA,DMA,EMA,ADX,MACD,RSIHind Applian 531918 WideScreen charts, DMA,SMA,EMA technical analysis, forecast prediction, by indicators ADX,MACD,RSI,CCI BSE stock exchange
Daily price and charts and targets HindApplian Strong Daily Stock price targets for HindApplian 531918 are 149.65 and 162.75 | Daily Target 1 | 138.73 | | Daily Target 2 | 147.47 | | Daily Target 3 | 151.83333333333 | | Daily Target 4 | 160.57 | | Daily Target 5 | 164.93 |
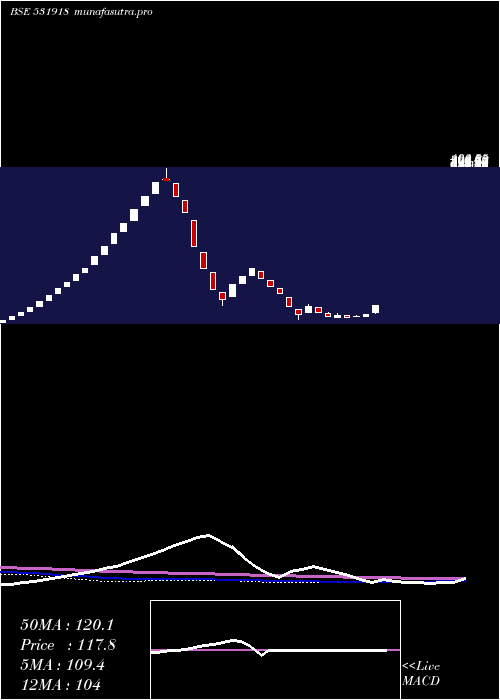
Daily price and volume Hind Applian
| Date |
Closing |
Open |
Range |
Volume |
Tue 21 October 2025 |
156.20 (19.97%) |
147.75 |
143.10 - 156.20 |
2.0886 times |
Mon 20 October 2025 |
130.20 (20%) |
110.70 |
102.80 - 130.20 |
6.2865 times |
Fri 17 October 2025 |
108.50 (5.75%) |
102.80 |
102.80 - 109.00 |
0.0613 times |
Thu 16 October 2025 |
102.60 (-2.38%) |
104.60 |
100.15 - 113.00 |
0.2664 times |
Wed 15 October 2025 |
105.10 (-5.7%) |
112.00 |
104.35 - 112.00 |
0.1904 times |
Tue 14 October 2025 |
111.45 (-0.49%) |
113.10 |
104.05 - 113.10 |
0.3524 times |
Mon 13 October 2025 |
112.00 (7.64%) |
104.05 |
101.05 - 112.00 |
0.1792 times |
Fri 10 October 2025 |
104.05 (-2.12%) |
103.00 |
103.00 - 107.95 |
0.4072 times |
Thu 09 October 2025 |
106.30 (-1.62%) |
110.25 |
105.00 - 110.25 |
0.1367 times |
Wed 08 October 2025 |
108.05 (-0.32%) |
108.40 |
107.00 - 108.40 |
0.0312 times |
Tue 07 October 2025 |
108.40 (0.37%) |
108.50 |
108.40 - 108.50 |
0.0778 times |

Weekly price and charts HindApplian Strong weekly Stock price targets for HindApplian 531918 are 129.5 and 182.9 | Weekly Target 1 | 85 | | Weekly Target 2 | 120.6 | | Weekly Target 3 | 138.4 | | Weekly Target 4 | 174 | | Weekly Target 5 | 191.8 |
Weekly price and volumes for Hind Applian
| Date |
Closing |
Open |
Range |
Volume |
Tue 21 October 2025 |
156.20 (43.96%) |
110.70 |
102.80 - 156.20 |
3.8512 times |
Fri 17 October 2025 |
108.50 (4.28%) |
104.05 |
100.15 - 113.10 |
0.4827 times |
Fri 10 October 2025 |
104.05 (-4.63%) |
109.00 |
103.00 - 110.25 |
0.322 times |
Fri 03 October 2025 |
109.10 (-0.68%) |
109.90 |
105.00 - 123.00 |
0.6314 times |
Fri 26 September 2025 |
109.85 (-7.14%) |
118.30 |
103.25 - 120.90 |
0.361 times |
Fri 19 September 2025 |
118.30 (8.23%) |
120.00 |
110.00 - 121.40 |
0.7726 times |
Fri 12 September 2025 |
109.30 (2.2%) |
110.00 |
95.05 - 110.00 |
1.9889 times |
Fri 05 September 2025 |
106.95 (3.73%) |
107.00 |
97.35 - 115.55 |
0.5108 times |
Fri 29 August 2025 |
103.10 (-1.48%) |
98.55 |
94.00 - 106.80 |
0.3829 times |
Fri 22 August 2025 |
104.65 (-3.98%) |
114.40 |
100.00 - 114.40 |
0.6965 times |
Thu 14 August 2025 |
108.99 (18.43%) |
98.50 |
97.91 - 113.99 |
1.8732 times |
Monthly price and charts HindApplian Strong monthly Stock price targets for HindApplian 531918 are 128.18 and 184.23 | Monthly Target 1 | 81.47 | | Monthly Target 2 | 118.83 | | Monthly Target 3 | 137.51666666667 | | Monthly Target 4 | 174.88 | | Monthly Target 5 | 193.57 |
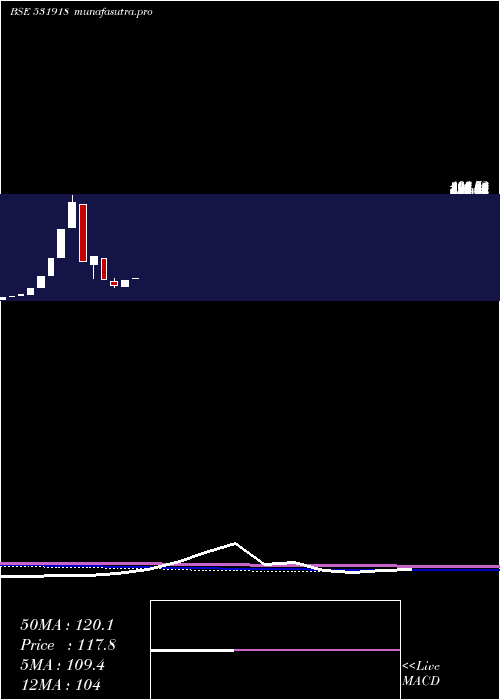
Monthly price and volumes Hind Applian
| Date |
Closing |
Open |
Range |
Volume |
Tue 21 October 2025 |
156.20 (41.81%) |
105.00 |
100.15 - 156.20 |
1.3885 times |
Tue 30 September 2025 |
110.15 (6.84%) |
107.00 |
95.05 - 123.00 |
1.1142 times |
Fri 29 August 2025 |
103.10 (4.25%) |
98.90 |
85.05 - 114.40 |
1.0434 times |
Thu 31 July 2025 |
98.90 (-8.72%) |
108.35 |
94.90 - 109.95 |
0.6466 times |
Mon 30 June 2025 |
108.35 (7.44%) |
98.85 |
98.85 - 119.05 |
1.0257 times |
Fri 30 May 2025 |
100.85 (-10.11%) |
117.70 |
100.85 - 138.90 |
0.8513 times |
Wed 30 April 2025 |
112.19 (19.16%) |
92.27 |
92.20 - 112.45 |
0.9298 times |
Fri 28 March 2025 |
94.15 (-18.31%) |
110.00 |
89.30 - 119.75 |
1.4387 times |
Fri 28 February 2025 |
115.25 (-40.85%) |
187.20 |
115.25 - 187.20 |
0.1515 times |
Fri 31 January 2025 |
194.85 (10.71%) |
167.20 |
116.90 - 194.85 |
1.4104 times |
Tue 31 December 2024 |
176.00 (-53.45%) |
370.55 |
176.00 - 370.55 |
0.3475 times |
DMA SMA EMA moving averages of Hind Applian 531918
DMA (daily moving average) of Hind Applian 531918
| DMA period | DMA value | | 5 day DMA | 120.52 | | 12 day DMA | 113.4 | | 20 day DMA | 112.98 | | 35 day DMA | 111.88 | | 50 day DMA | 109.38 | | 100 day DMA | 106.96 | | 150 day DMA | 107.72 | | 200 day DMA | 120.32 | EMA (exponential moving average) of Hind Applian 531918
| EMA period | EMA current | EMA prev | EMA prev2 | | 5 day EMA | 128.54 | 114.71 | 106.96 | | 12 day EMA | 118.35 | 111.47 | 108.06 | | 20 day EMA | 115.06 | 110.73 | 108.68 | | 35 day EMA | 111.57 | 108.94 | 107.69 | | 50 day EMA | 109.69 | 107.79 | 106.88 |
SMA (simple moving average) of Hind Applian 531918
| SMA period | SMA current | SMA prev | SMA prev2 | | 5 day SMA | 120.52 | 111.57 | 107.93 | | 12 day SMA | 113.4 | 109.48 | 107.55 | | 20 day SMA | 112.98 | 111.04 | 110.44 | | 35 day SMA | 111.88 | 110.42 | 109.65 | | 50 day SMA | 109.38 | 108.23 | 107.51 | | 100 day SMA | 106.96 | 106.45 | 106.22 | | 150 day SMA | 107.72 | 107.33 | 107.16 | | 200 day SMA | 120.32 | 120.68 | 121.22 |
|
|
