GopalIron 531913 full analysis,charts,indicators,moving averages,SMA,DMA,EMA,ADX,MACD,RSIGopal Iron 531913 WideScreen charts, DMA,SMA,EMA technical analysis, forecast prediction, by indicators ADX,MACD,RSI,CCI BSE stock exchange
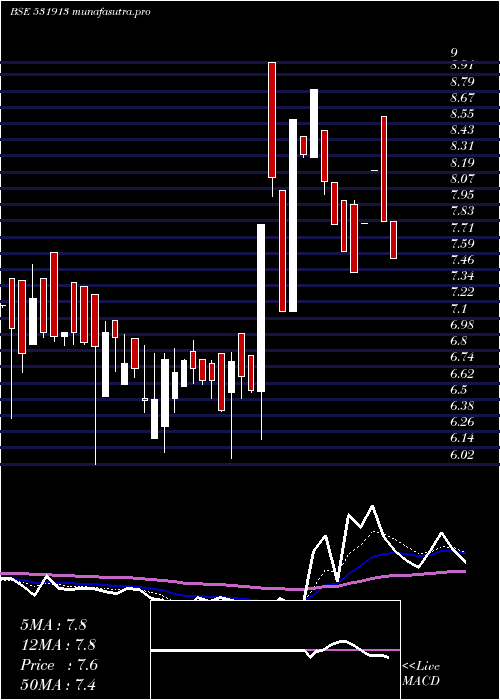
Daily price and charts and targets GopalIron Strong Daily Stock price targets for GopalIron 531913 are 8.07 and 8.2 | Daily Target 1 | 7.96 | | Daily Target 2 | 8.04 | | Daily Target 3 | 8.0866666666667 | | Daily Target 4 | 8.17 | | Daily Target 5 | 8.22 |
Daily price and volume Gopal Iron
| Date |
Closing |
Open |
Range |
Volume |
Wed 16 July 2025 |
8.13 (0%) |
8.13 |
8.00 - 8.13 |
0.708 times |
Tue 15 July 2025 |
8.13 (0%) |
8.49 |
8.13 - 8.49 |
0.2435 times |
Mon 14 July 2025 |
8.13 (4.9%) |
7.76 |
7.76 - 8.13 |
3.1126 times |
Fri 11 July 2025 |
7.75 (4.87%) |
7.40 |
7.40 - 7.75 |
1.8228 times |
Thu 10 July 2025 |
7.39 (4.67%) |
7.06 |
7.06 - 7.39 |
1.333 times |
Wed 09 July 2025 |
7.06 (-0.42%) |
7.09 |
7.06 - 7.09 |
1.0713 times |
Tue 08 July 2025 |
7.09 (-0.28%) |
7.08 |
6.86 - 7.09 |
0.4116 times |
Mon 07 July 2025 |
7.11 (0.42%) |
7.08 |
7.08 - 7.11 |
0.9001 times |
Fri 04 July 2025 |
7.08 (-0.98%) |
7.15 |
7.08 - 7.15 |
0.2547 times |
Thu 03 July 2025 |
7.15 (2.73%) |
7.29 |
7.15 - 7.29 |
0.1423 times |
Wed 02 July 2025 |
6.96 (-0.29%) |
6.71 |
6.71 - 7.27 |
0.7587 times |
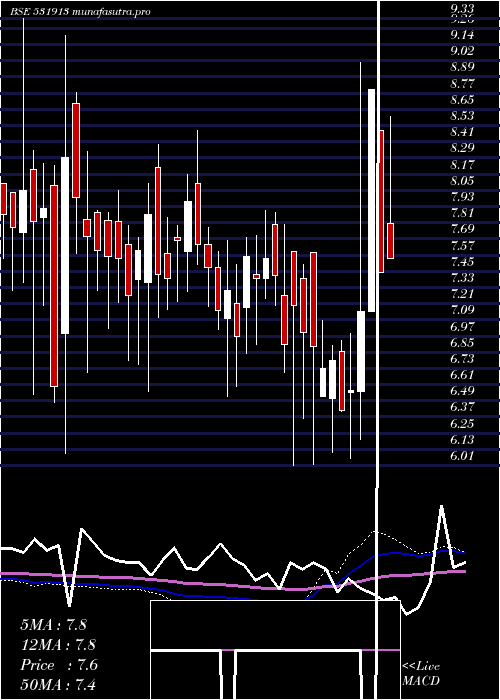
Weekly price and charts GopalIron Strong weekly Stock price targets for GopalIron 531913 are 7.95 and 8.68 | Weekly Target 1 | 7.4 | | Weekly Target 2 | 7.76 | | Weekly Target 3 | 8.1266666666667 | | Weekly Target 4 | 8.49 | | Weekly Target 5 | 8.86 |
Weekly price and volumes for Gopal Iron
| Date |
Closing |
Open |
Range |
Volume |
Wed 16 July 2025 |
8.13 (4.9%) |
7.76 |
7.76 - 8.49 |
1.3837 times |
Fri 11 July 2025 |
7.75 (9.46%) |
7.08 |
6.86 - 7.75 |
1.8857 times |
Fri 04 July 2025 |
7.08 (1%) |
6.98 |
6.71 - 7.29 |
1.0316 times |
Fri 27 June 2025 |
7.01 (5.26%) |
6.68 |
6.53 - 7.06 |
0.6392 times |
Thu 19 June 2025 |
6.66 (-6.06%) |
7.09 |
6.65 - 7.30 |
0.7821 times |
Fri 13 June 2025 |
7.09 (-6.34%) |
7.58 |
6.92 - 7.89 |
1.0738 times |
Fri 06 June 2025 |
7.57 (-4.42%) |
7.92 |
7.41 - 7.92 |
0.4917 times |
Fri 30 May 2025 |
7.92 (-3.65%) |
8.18 |
7.70 - 8.19 |
0.7288 times |
Fri 23 May 2025 |
8.22 (-2.95%) |
8.20 |
7.87 - 8.70 |
1.2302 times |
Fri 16 May 2025 |
8.47 (13.08%) |
7.86 |
7.70 - 8.56 |
0.7532 times |
Fri 09 May 2025 |
7.49 (-0.79%) |
7.88 |
7.27 - 7.88 |
0.3893 times |
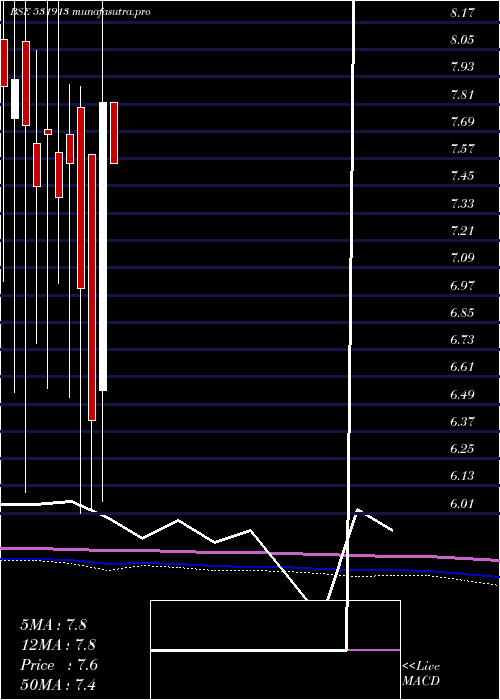
Monthly price and charts GopalIron Strong monthly Stock price targets for GopalIron 531913 are 7.42 and 9.2 | Monthly Target 1 | 6 | | Monthly Target 2 | 7.06 | | Monthly Target 3 | 7.7766666666667 | | Monthly Target 4 | 8.84 | | Monthly Target 5 | 9.56 |
Monthly price and volumes Gopal Iron
| Date |
Closing |
Open |
Range |
Volume |
Wed 16 July 2025 |
8.13 (16.14%) |
7.00 |
6.71 - 8.49 |
0.5565 times |
Mon 30 June 2025 |
7.00 (-11.62%) |
7.92 |
6.53 - 7.92 |
0.4418 times |
Fri 30 May 2025 |
7.92 (1.28%) |
7.82 |
7.27 - 8.70 |
0.4635 times |
Wed 30 April 2025 |
7.82 (21.81%) |
6.55 |
6.06 - 9.00 |
1.3545 times |
Fri 28 March 2025 |
6.42 (-8.29%) |
7.59 |
6.02 - 7.59 |
0.7687 times |
Fri 28 February 2025 |
7.00 (-7.28%) |
7.80 |
6.01 - 7.89 |
0.7156 times |
Fri 31 January 2025 |
7.55 (2.03%) |
7.68 |
6.52 - 7.90 |
0.9279 times |
Tue 31 December 2024 |
7.40 (-3.65%) |
7.60 |
7.02 - 8.50 |
1.85 times |
Fri 29 November 2024 |
7.68 (3.09%) |
7.70 |
6.56 - 8.39 |
1.2565 times |
Thu 31 October 2024 |
7.45 (-3.5%) |
7.64 |
6.76 - 8.05 |
1.665 times |
Mon 30 September 2024 |
7.72 (-2.53%) |
8.09 |
6.10 - 9.20 |
20.0201 times |
DMA SMA EMA moving averages of Gopal Iron 531913
DMA (daily moving average) of Gopal Iron 531913
| DMA period | DMA value | | 5 day DMA | 7.91 | | 12 day DMA | 7.41 | | 20 day DMA | 7.22 | | 35 day DMA | 7.37 | | 50 day DMA | 7.58 | | 100 day DMA | 7.39 | | 150 day DMA | 7.4 | | 200 day DMA | 7.44 | EMA (exponential moving average) of Gopal Iron 531913
| EMA period | EMA current | EMA prev | EMA prev2 | | 5 day EMA | 7.9 | 7.79 | 7.62 | | 12 day EMA | 7.58 | 7.48 | 7.36 | | 20 day EMA | 7.47 | 7.4 | 7.32 | | 35 day EMA | 7.46 | 7.42 | 7.38 | | 50 day EMA | 7.62 | 7.6 | 7.58 |
SMA (simple moving average) of Gopal Iron 531913
| SMA period | SMA current | SMA prev | SMA prev2 | | 5 day SMA | 7.91 | 7.69 | 7.48 | | 12 day SMA | 7.41 | 7.32 | 7.23 | | 20 day SMA | 7.22 | 7.17 | 7.13 | | 35 day SMA | 7.37 | 7.36 | 7.35 | | 50 day SMA | 7.58 | 7.57 | 7.55 | | 100 day SMA | 7.39 | 7.38 | 7.38 | | 150 day SMA | 7.4 | 7.4 | 7.39 | | 200 day SMA | 7.44 | 7.44 | 7.45 |
|
|
