SawacaBusi 531893 full analysis,charts,indicators,moving averages,SMA,DMA,EMA,ADX,MACD,RSISawaca Busi 531893 WideScreen charts, DMA,SMA,EMA technical analysis, forecast prediction, by indicators ADX,MACD,RSI,CCI BSE stock exchange
Daily price and charts and targets SawacaBusi Strong Daily Stock price targets for SawacaBusi 531893 are 0.43 and 0.47 | Daily Target 1 | 0.4 | | Daily Target 2 | 0.42 | | Daily Target 3 | 0.44 | | Daily Target 4 | 0.46 | | Daily Target 5 | 0.48 |
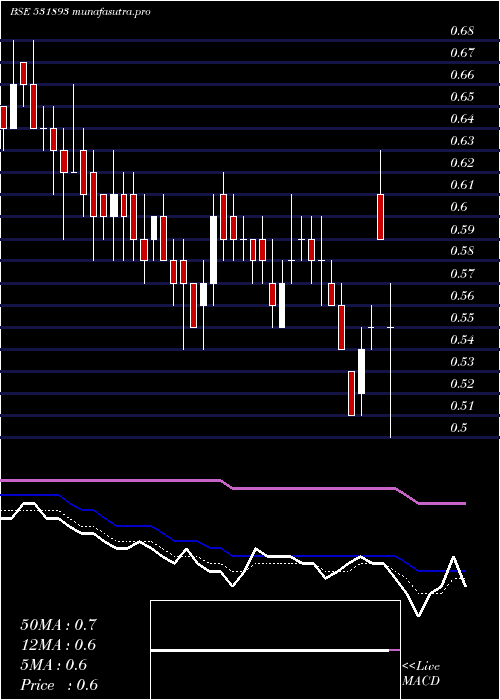
Daily price and volume Sawaca Busi
| Date |
Closing |
Open |
Range |
Volume |
Fri 17 October 2025 |
0.44 (2.33%) |
0.43 |
0.42 - 0.46 |
1.0179 times |
Thu 16 October 2025 |
0.43 (4.88%) |
0.42 |
0.41 - 0.46 |
1.6079 times |
Wed 15 October 2025 |
0.41 (-2.38%) |
0.41 |
0.41 - 0.42 |
0.805 times |
Tue 14 October 2025 |
0.42 (0%) |
0.42 |
0.40 - 0.42 |
0.8426 times |
Mon 13 October 2025 |
0.42 (-2.33%) |
0.43 |
0.40 - 0.44 |
1.4008 times |
Fri 10 October 2025 |
0.43 (0%) |
0.43 |
0.42 - 0.44 |
1.1209 times |
Thu 09 October 2025 |
0.43 (-4.44%) |
0.46 |
0.42 - 0.46 |
0.9844 times |
Wed 08 October 2025 |
0.45 (2.27%) |
0.44 |
0.44 - 0.46 |
0.6045 times |
Tue 07 October 2025 |
0.44 (2.33%) |
0.43 |
0.43 - 0.46 |
0.6466 times |
Mon 06 October 2025 |
0.43 (-4.44%) |
0.45 |
0.43 - 0.46 |
0.9694 times |
Fri 03 October 2025 |
0.45 (2.27%) |
0.44 |
0.44 - 0.45 |
0.383 times |
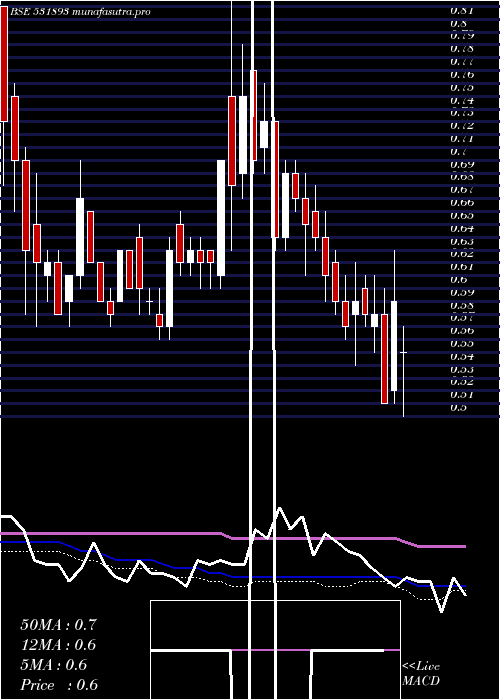
Weekly price and charts SawacaBusi Strong weekly Stock price targets for SawacaBusi 531893 are 0.42 and 0.48 | Weekly Target 1 | 0.37 | | Weekly Target 2 | 0.41 | | Weekly Target 3 | 0.43333333333333 | | Weekly Target 4 | 0.47 | | Weekly Target 5 | 0.49 |
Weekly price and volumes for Sawaca Busi
| Date |
Closing |
Open |
Range |
Volume |
Fri 17 October 2025 |
0.44 (2.33%) |
0.43 |
0.40 - 0.46 |
1.3626 times |
Fri 10 October 2025 |
0.43 (-4.44%) |
0.45 |
0.42 - 0.46 |
1.0388 times |
Fri 03 October 2025 |
0.45 (0%) |
0.45 |
0.44 - 0.46 |
0.5204 times |
Fri 26 September 2025 |
0.45 (-2.17%) |
0.47 |
0.44 - 0.48 |
1.0542 times |
Fri 19 September 2025 |
0.46 (-4.17%) |
0.48 |
0.45 - 0.49 |
0.9204 times |
Fri 12 September 2025 |
0.48 (14.29%) |
0.42 |
0.42 - 0.52 |
1.9602 times |
Fri 05 September 2025 |
0.42 (2.44%) |
0.42 |
0.41 - 0.43 |
0.8793 times |
Fri 29 August 2025 |
0.41 (-4.65%) |
0.43 |
0.40 - 0.44 |
0.9593 times |
Fri 22 August 2025 |
0.43 (0%) |
0.43 |
0.42 - 0.44 |
0.7471 times |
Thu 14 August 2025 |
0.43 (-2.27%) |
0.44 |
0.43 - 0.45 |
0.5578 times |
Fri 08 August 2025 |
0.44 (0%) |
0.44 |
0.43 - 0.45 |
0.5415 times |
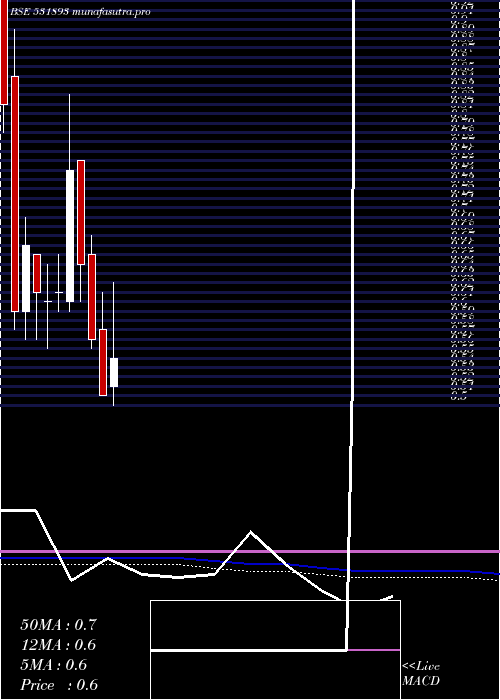
Monthly price and charts SawacaBusi Strong monthly Stock price targets for SawacaBusi 531893 are 0.39 and 0.45 | Monthly Target 1 | 0.37 | | Monthly Target 2 | 0.41 | | Monthly Target 3 | 0.43333333333333 | | Monthly Target 4 | 0.47 | | Monthly Target 5 | 0.49 |
Monthly price and volumes Sawaca Busi
| Date |
Closing |
Open |
Range |
Volume |
Fri 17 October 2025 |
0.44 (0%) |
0.45 |
0.40 - 0.46 |
0.5008 times |
Tue 30 September 2025 |
0.44 (7.32%) |
0.42 |
0.41 - 0.52 |
0.9885 times |
Fri 29 August 2025 |
0.41 (-8.89%) |
0.45 |
0.40 - 0.45 |
0.5622 times |
Thu 31 July 2025 |
0.45 (-8.16%) |
0.49 |
0.41 - 0.50 |
0.9684 times |
Mon 30 June 2025 |
0.49 (-3.92%) |
0.51 |
0.46 - 0.52 |
0.9833 times |
Fri 30 May 2025 |
0.51 (-1.92%) |
0.52 |
0.46 - 0.56 |
0.8876 times |
Wed 30 April 2025 |
0.52 (1.96%) |
0.52 |
0.50 - 0.63 |
0.7238 times |
Fri 28 March 2025 |
0.51 (-10.53%) |
0.58 |
0.51 - 0.62 |
1.0899 times |
Fri 28 February 2025 |
0.57 (-12.31%) |
0.66 |
0.56 - 0.68 |
1.2879 times |
Fri 31 January 2025 |
0.65 (-13.33%) |
0.76 |
0.61 - 0.76 |
2.0077 times |
Tue 31 December 2024 |
0.75 (20.97%) |
0.61 |
0.60 - 0.83 |
5.3742 times |
DMA SMA EMA moving averages of Sawaca Busi 531893
DMA (daily moving average) of Sawaca Busi 531893
| DMA period | DMA value | | 5 day DMA | 0.42 | | 12 day DMA | 0.43 | | 20 day DMA | 0.44 | | 35 day DMA | 0.44 | | 50 day DMA | 0.44 | | 100 day DMA | 0.46 | | 150 day DMA | 0.49 | | 200 day DMA | 0.53 | EMA (exponential moving average) of Sawaca Busi 531893
| EMA period | EMA current | EMA prev | EMA prev2 | | 5 day EMA | 0.43 | 0.42 | 0.42 | | 12 day EMA | 0.44 | 0.44 | 0.44 | | 20 day EMA | 0.44 | 0.44 | 0.44 | | 35 day EMA | 0.44 | 0.44 | 0.44 | | 50 day EMA | 0.44 | 0.44 | 0.44 |
SMA (simple moving average) of Sawaca Busi 531893
| SMA period | SMA current | SMA prev | SMA prev2 | | 5 day SMA | 0.42 | 0.42 | 0.42 | | 12 day SMA | 0.43 | 0.43 | 0.43 | | 20 day SMA | 0.44 | 0.44 | 0.45 | | 35 day SMA | 0.44 | 0.44 | 0.44 | | 50 day SMA | 0.44 | 0.44 | 0.44 | | 100 day SMA | 0.46 | 0.46 | 0.46 | | 150 day SMA | 0.49 | 0.49 | 0.49 | | 200 day SMA | 0.53 | 0.53 | 0.54 |
|
|
