SgnTelecoms 531812 full analysis,charts,indicators,moving averages,SMA,DMA,EMA,ADX,MACD,RSISgn Telecoms 531812 WideScreen charts, DMA,SMA,EMA technical analysis, forecast prediction, by indicators ADX,MACD,RSI,CCI BSE stock exchange
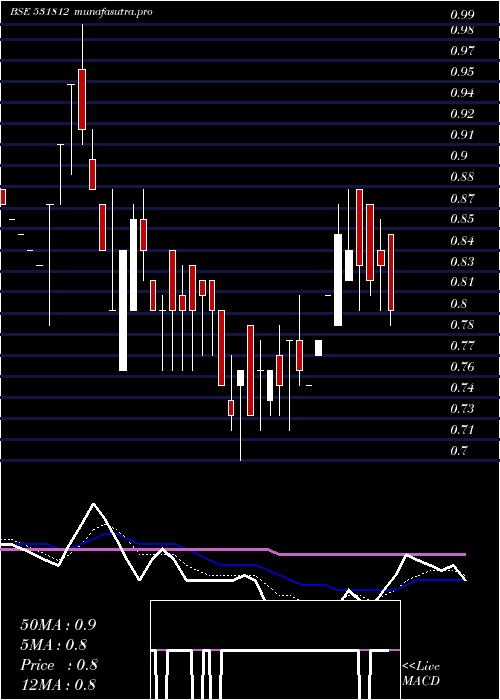
Daily price and charts and targets SgnTelecoms Strong Daily Stock price targets for SgnTelecoms 531812 are 0.72 and 0.78 | Daily Target 1 | 0.7 | | Daily Target 2 | 0.74 | | Daily Target 3 | 0.76333333333333 | | Daily Target 4 | 0.8 | | Daily Target 5 | 0.82 |
Daily price and volume Sgn Telecoms
| Date |
Closing |
Open |
Range |
Volume |
Thu 23 October 2025 |
0.77 (1.32%) |
0.79 |
0.73 - 0.79 |
0.8979 times |
Tue 21 October 2025 |
0.76 (2.7%) |
0.77 |
0.75 - 0.77 |
1.0028 times |
Mon 20 October 2025 |
0.74 (2.78%) |
0.73 |
0.70 - 0.75 |
0.4369 times |
Fri 17 October 2025 |
0.72 (2.86%) |
0.70 |
0.67 - 0.73 |
1.9581 times |
Thu 16 October 2025 |
0.70 (-2.78%) |
0.72 |
0.69 - 0.73 |
0.3794 times |
Wed 15 October 2025 |
0.72 (2.86%) |
0.70 |
0.70 - 0.73 |
0.6623 times |
Tue 14 October 2025 |
0.70 (1.45%) |
0.70 |
0.67 - 0.72 |
1.2752 times |
Mon 13 October 2025 |
0.69 (-4.17%) |
0.75 |
0.69 - 0.75 |
2.0045 times |
Fri 10 October 2025 |
0.72 (4.35%) |
0.70 |
0.70 - 0.72 |
1.2277 times |
Thu 09 October 2025 |
0.69 (1.47%) |
0.68 |
0.68 - 0.69 |
0.1551 times |
Wed 08 October 2025 |
0.68 (0%) |
0.68 |
0.68 - 0.68 |
0.0557 times |
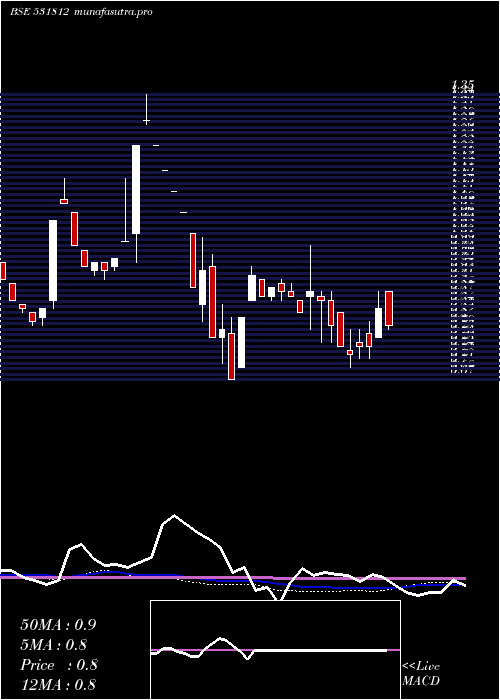
Weekly price and charts SgnTelecoms Strong weekly Stock price targets for SgnTelecoms 531812 are 0.74 and 0.83 | Weekly Target 1 | 0.66 | | Weekly Target 2 | 0.72 | | Weekly Target 3 | 0.75333333333333 | | Weekly Target 4 | 0.81 | | Weekly Target 5 | 0.84 |
Weekly price and volumes for Sgn Telecoms
| Date |
Closing |
Open |
Range |
Volume |
Thu 23 October 2025 |
0.77 (6.94%) |
0.73 |
0.70 - 0.79 |
0.8751 times |
Fri 17 October 2025 |
0.72 (0%) |
0.75 |
0.67 - 0.75 |
2.3509 times |
Fri 10 October 2025 |
0.72 (7.46%) |
0.67 |
0.67 - 0.72 |
0.8053 times |
Fri 03 October 2025 |
0.67 (-2.9%) |
0.69 |
0.64 - 0.69 |
0.2717 times |
Fri 26 September 2025 |
0.69 (-2.82%) |
0.71 |
0.69 - 0.72 |
1.2474 times |
Fri 19 September 2025 |
0.71 (-7.79%) |
0.77 |
0.67 - 0.77 |
1.1606 times |
Fri 12 September 2025 |
0.77 (22.22%) |
0.65 |
0.65 - 0.77 |
1.1889 times |
Fri 05 September 2025 |
0.63 (5%) |
0.61 |
0.57 - 0.63 |
0.9998 times |
Fri 29 August 2025 |
0.60 (-10.45%) |
0.67 |
0.60 - 0.67 |
0.488 times |
Fri 22 August 2025 |
0.67 (4.69%) |
0.64 |
0.58 - 0.67 |
0.6123 times |
Thu 14 August 2025 |
0.64 (0%) |
0.64 |
0.61 - 0.64 |
0.3964 times |
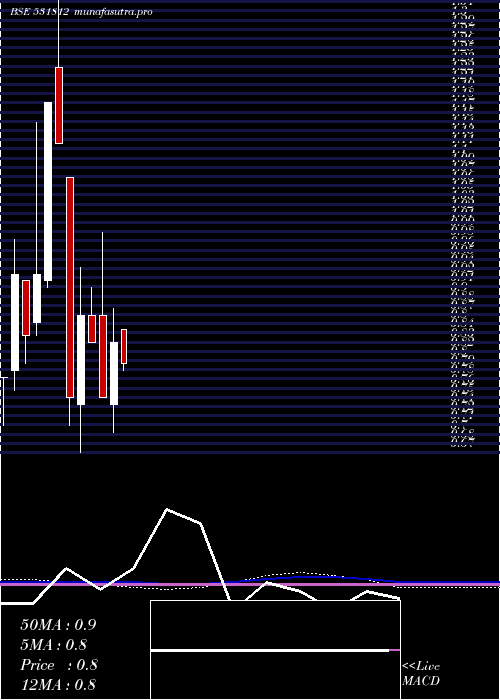
Monthly price and charts SgnTelecoms Strong monthly Stock price targets for SgnTelecoms 531812 are 0.71 and 0.86 | Monthly Target 1 | 0.58 | | Monthly Target 2 | 0.68 | | Monthly Target 3 | 0.73333333333333 | | Monthly Target 4 | 0.83 | | Monthly Target 5 | 0.88 |
Monthly price and volumes Sgn Telecoms
| Date |
Closing |
Open |
Range |
Volume |
Thu 23 October 2025 |
0.77 (14.93%) |
0.67 |
0.64 - 0.79 |
0.6156 times |
Tue 30 September 2025 |
0.67 (11.67%) |
0.61 |
0.57 - 0.77 |
0.704 times |
Fri 29 August 2025 |
0.60 (-15.49%) |
0.71 |
0.58 - 0.71 |
0.298 times |
Thu 31 July 2025 |
0.71 (-6.58%) |
0.79 |
0.69 - 0.81 |
0.6676 times |
Mon 30 June 2025 |
0.76 (8.57%) |
0.72 |
0.67 - 0.97 |
2.4202 times |
Fri 30 May 2025 |
0.70 (-15.66%) |
0.85 |
0.66 - 0.85 |
1.5738 times |
Wed 30 April 2025 |
0.83 (10.67%) |
0.74 |
0.70 - 0.88 |
0.8295 times |
Fri 28 March 2025 |
0.75 (-9.64%) |
0.87 |
0.75 - 0.99 |
1.2627 times |
Fri 28 February 2025 |
0.83 (-4.6%) |
0.87 |
0.83 - 0.91 |
0.5732 times |
Fri 31 January 2025 |
0.87 (16%) |
0.74 |
0.67 - 0.94 |
1.0554 times |
Tue 31 December 2024 |
0.75 (-33.04%) |
1.07 |
0.71 - 1.07 |
0.6411 times |
DMA SMA EMA moving averages of Sgn Telecoms 531812
DMA (daily moving average) of Sgn Telecoms 531812
| DMA period | DMA value | | 5 day DMA | 0.74 | | 12 day DMA | 0.71 | | 20 day DMA | 0.7 | | 35 day DMA | 0.7 | | 50 day DMA | 0.68 | | 100 day DMA | 0.71 | | 150 day DMA | 0.73 | | 200 day DMA | 0.76 | EMA (exponential moving average) of Sgn Telecoms 531812
| EMA period | EMA current | EMA prev | EMA prev2 | | 5 day EMA | 0.74 | 0.73 | 0.72 | | 12 day EMA | 0.72 | 0.71 | 0.7 | | 20 day EMA | 0.71 | 0.7 | 0.69 | | 35 day EMA | 0.68 | 0.67 | 0.66 | | 50 day EMA | 0.67 | 0.67 | 0.67 |
SMA (simple moving average) of Sgn Telecoms 531812
| SMA period | SMA current | SMA prev | SMA prev2 | | 5 day SMA | 0.74 | 0.73 | 0.72 | | 12 day SMA | 0.71 | 0.71 | 0.7 | | 20 day SMA | 0.7 | 0.7 | 0.69 | | 35 day SMA | 0.7 | 0.69 | 0.69 | | 50 day SMA | 0.68 | 0.67 | 0.67 | | 100 day SMA | 0.71 | 0.71 | 0.71 | | 150 day SMA | 0.73 | 0.73 | 0.74 | | 200 day SMA | 0.76 | 0.76 | 0.76 |
|
|
