Apollopipes 531761 full analysis,charts,indicators,moving averages,SMA,DMA,EMA,ADX,MACD,RSIApollopipes 531761 WideScreen charts, DMA,SMA,EMA technical analysis, forecast prediction, by indicators ADX,MACD,RSI,CCI BSE stock exchange
Daily price and charts and targets Apollopipes Strong Daily Stock price targets for Apollopipes 531761 are 376.43 and 398.78 | Daily Target 1 | 370.9 | | Daily Target 2 | 381.95 | | Daily Target 3 | 393.25 | | Daily Target 4 | 404.3 | | Daily Target 5 | 415.6 |
Daily price and volume Apollopipes
| Date |
Closing |
Open |
Range |
Volume |
| Fri 02 May 2025 |
393.00 (-0.87%) |
403.00 |
382.20 - 404.55 |
2.1298 times |
| Wed 30 April 2025 |
396.45 (-1.47%) |
401.50 |
389.30 - 401.50 |
0.3633 times |
| Tue 29 April 2025 |
402.35 (2.08%) |
395.80 |
387.05 - 405.65 |
1.7955 times |
| Mon 28 April 2025 |
394.15 (5.28%) |
374.00 |
370.00 - 410.10 |
1.2415 times |
| Fri 25 April 2025 |
374.40 (-4.93%) |
395.00 |
370.75 - 395.00 |
0.3263 times |
| Thu 24 April 2025 |
393.80 (-0.57%) |
403.00 |
390.45 - 403.00 |
0.8235 times |
| Tue 22 April 2025 |
396.05 (0.58%) |
398.25 |
390.55 - 400.75 |
0.4753 times |
| Mon 21 April 2025 |
393.75 (0.31%) |
393.00 |
391.60 - 399.15 |
1.257 times |
| Thu 17 April 2025 |
392.55 (0.62%) |
381.05 |
381.05 - 406.40 |
1.2844 times |
| Wed 16 April 2025 |
390.15 (0.72%) |
389.00 |
387.85 - 398.45 |
0.3034 times |
| Tue 15 April 2025 |
387.35 (-1.31%) |
399.50 |
385.00 - 399.50 |
2.31 times |
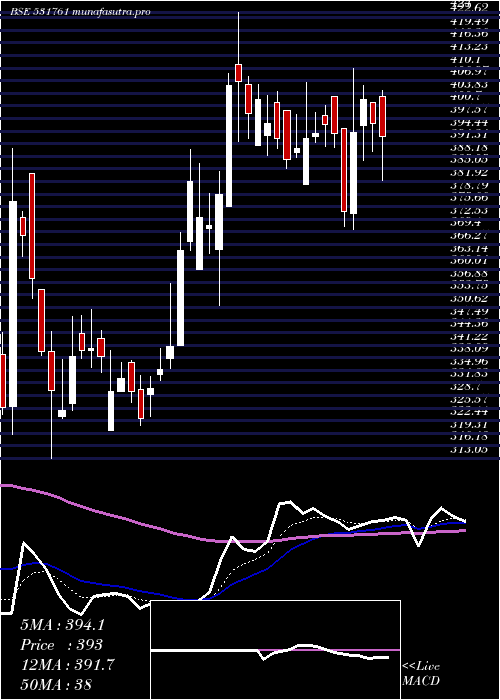
Weekly price and charts Apollopipes Strong weekly Stock price targets for Apollopipes 531761 are 381.5 and 421.6 | Weekly Target 1 | 350.93 | | Weekly Target 2 | 371.97 | | Weekly Target 3 | 391.03333333333 | | Weekly Target 4 | 412.07 | | Weekly Target 5 | 431.13 |
Weekly price and volumes for Apollopipes
| Date |
Closing |
Open |
Range |
Volume |
| Fri 02 May 2025 |
393.00 (4.97%) |
374.00 |
370.00 - 410.10 |
1.0433 times |
| Fri 25 April 2025 |
374.40 (-4.62%) |
393.00 |
370.75 - 403.00 |
0.5437 times |
| Thu 17 April 2025 |
392.55 (0.01%) |
399.50 |
381.05 - 406.40 |
0.7354 times |
| Fri 11 April 2025 |
392.50 (-1.56%) |
390.95 |
388.25 - 406.05 |
0.2464 times |
| Fri 04 April 2025 |
398.70 (5.3%) |
375.75 |
375.75 - 424.00 |
0.8888 times |
| Fri 28 March 2025 |
378.65 (3.78%) |
366.95 |
351.00 - 389.95 |
1.0086 times |
| Fri 21 March 2025 |
364.85 (10.69%) |
330.20 |
321.30 - 369.30 |
1.3315 times |
| Thu 13 March 2025 |
329.60 (-3.16%) |
342.95 |
320.05 - 344.90 |
1.6798 times |
| Fri 07 March 2025 |
340.35 (0.21%) |
339.65 |
313.05 - 350.00 |
1.6225 times |
| Fri 28 February 2025 |
339.65 (4.24%) |
326.00 |
319.00 - 390.15 |
0.9 times |
| Fri 21 February 2025 |
325.85 (-7.94%) |
350.10 |
319.95 - 354.50 |
0.9626 times |
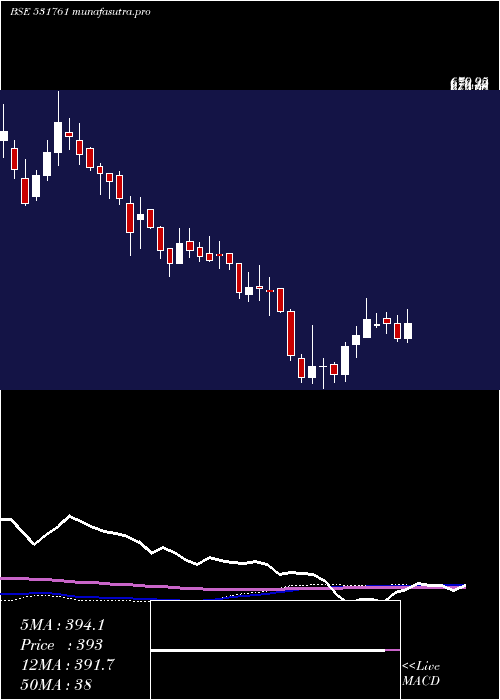
Monthly price and charts Apollopipes Strong monthly Stock price targets for Apollopipes 531761 are 376.43 and 398.78 | Monthly Target 1 | 370.9 | | Monthly Target 2 | 381.95 | | Monthly Target 3 | 393.25 | | Monthly Target 4 | 404.3 | | Monthly Target 5 | 415.6 |
Monthly price and volumes Apollopipes
| Date |
Closing |
Open |
Range |
Volume |
| Fri 02 May 2025 |
393.00 (-0.87%) |
403.00 |
382.20 - 404.55 |
0.1141 times |
| Wed 30 April 2025 |
396.45 (4.7%) |
375.75 |
370.00 - 424.00 |
0.8676 times |
| Fri 28 March 2025 |
378.65 (11.48%) |
339.65 |
313.05 - 389.95 |
1.6019 times |
| Fri 28 February 2025 |
339.65 (-21.55%) |
437.00 |
319.00 - 437.00 |
1.0896 times |
| Fri 31 January 2025 |
432.95 (-6.7%) |
466.40 |
402.95 - 471.00 |
0.7868 times |
| Tue 31 December 2024 |
464.05 (-5.62%) |
495.00 |
459.75 - 510.55 |
0.6457 times |
| Fri 29 November 2024 |
491.70 (-7.2%) |
545.60 |
451.70 - 545.60 |
0.452 times |
| Thu 31 October 2024 |
529.85 (-8.42%) |
571.85 |
477.00 - 590.30 |
0.8175 times |
| Mon 30 September 2024 |
578.55 (-4.4%) |
604.95 |
578.00 - 679.95 |
2.1066 times |
| Fri 30 August 2024 |
605.20 (-5.18%) |
649.00 |
539.10 - 664.20 |
1.5181 times |
| Wed 31 July 2024 |
638.25 (0.96%) |
643.80 |
598.90 - 644.25 |
1.0342 times |
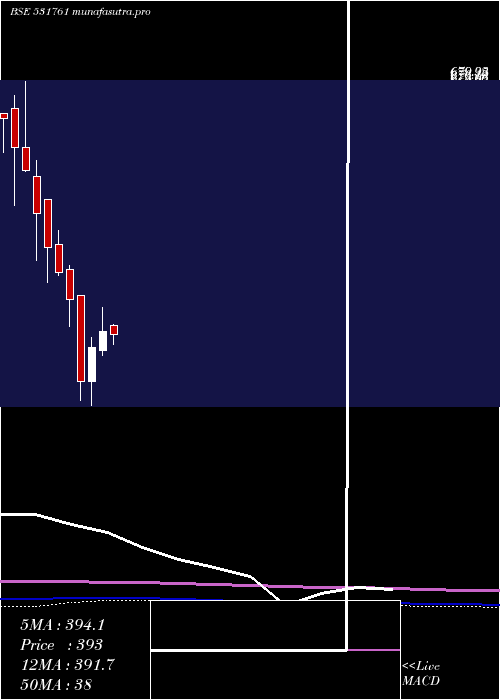
DMA SMA EMA moving averages of Apollopipes 531761
DMA (daily moving average) of Apollopipes 531761
| DMA period | DMA value | | 5 day DMA | 392.07 | | 12 day DMA | 392.21 | | 20 day DMA | 391.94 | | 35 day DMA | 369.12 | | 50 day DMA | 365.75 | | 100 day DMA | 410.92 | | 150 day DMA | 454.29 | | 200 day DMA | 492.96 | EMA (exponential moving average) of Apollopipes 531761
| EMA period | EMA current | EMA prev | EMA prev2 | | 5 day EMA | 394.14 | 394.71 | 393.84 | | 12 day EMA | 391.66 | 391.42 | 390.5 | | 20 day EMA | 387.12 | 386.5 | 385.45 | | 35 day EMA | 381.97 | 381.32 | 380.43 | | 50 day EMA | 373.27 | 372.47 | 371.49 |
SMA (simple moving average) of Apollopipes 531761
| SMA period | SMA current | SMA prev | SMA prev2 | | 5 day SMA | 392.07 | 392.23 | 392.15 | | 12 day SMA | 392.21 | 392.48 | 392.96 | | 20 day SMA | 391.94 | 391.38 | 389.8 | | 35 day SMA | 369.12 | 367.6 | 366.49 | | 50 day SMA | 365.75 | 366.26 | 366.71 | | 100 day SMA | 410.92 | 411.97 | 412.96 | | 150 day SMA | 454.29 | 455.89 | 457.32 | | 200 day SMA | 492.96 | 494.17 | 495.34 |
|
|
