TrijalInd 531658 full analysis,charts,indicators,moving averages,SMA,DMA,EMA,ADX,MACD,RSITrijal Ind 531658 WideScreen charts, DMA,SMA,EMA technical analysis, forecast prediction, by indicators ADX,MACD,RSI,CCI BSE stock exchange
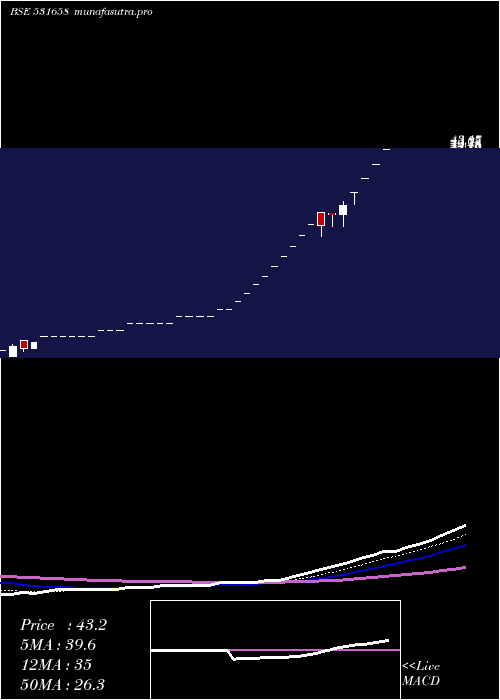
Daily price and charts and targets TrijalInd Strong Daily Stock price targets for TrijalInd 531658 are 17.48 and 19.36 | Daily Target 1 | 15.93 | | Daily Target 2 | 17.14 | | Daily Target 3 | 17.81 | | Daily Target 4 | 19.02 | | Daily Target 5 | 19.69 |
Daily price and volume Trijal Ind
| Date |
Closing |
Open |
Range |
Volume |
Fri 05 December 2025 |
18.35 (2.86%) |
16.60 |
16.60 - 18.48 |
0.7764 times |
Thu 04 December 2025 |
17.84 (2.71%) |
17.98 |
17.03 - 17.98 |
0.6482 times |
Wed 03 December 2025 |
17.37 (1.64%) |
17.94 |
16.56 - 17.94 |
0.6039 times |
Tue 02 December 2025 |
17.09 (2.34%) |
15.91 |
15.91 - 17.50 |
0.298 times |
Mon 01 December 2025 |
16.70 (-4.95%) |
17.55 |
16.70 - 17.55 |
2.6826 times |
Fri 28 November 2025 |
17.57 (-2.23%) |
18.60 |
17.08 - 18.60 |
3.1512 times |
Thu 27 November 2025 |
17.97 (-0.28%) |
17.33 |
17.33 - 18.50 |
0.3668 times |
Wed 26 November 2025 |
18.02 (-2.49%) |
17.68 |
17.68 - 18.94 |
0.4756 times |
Tue 25 November 2025 |
18.48 (2.04%) |
18.69 |
17.26 - 18.69 |
0.7062 times |
Mon 24 November 2025 |
18.11 (-3.52%) |
17.84 |
17.84 - 19.06 |
0.2911 times |
Fri 21 November 2025 |
18.77 (-0.95%) |
19.00 |
18.31 - 19.17 |
1.3983 times |
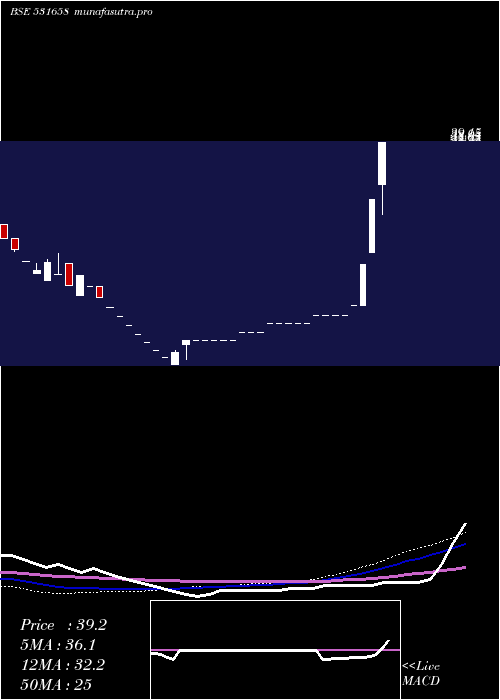
Weekly price and charts TrijalInd Strong weekly Stock price targets for TrijalInd 531658 are 17.13 and 19.7 | Weekly Target 1 | 15.01 | | Weekly Target 2 | 16.68 | | Weekly Target 3 | 17.58 | | Weekly Target 4 | 19.25 | | Weekly Target 5 | 20.15 |
Weekly price and volumes for Trijal Ind
| Date |
Closing |
Open |
Range |
Volume |
Fri 05 December 2025 |
18.35 (4.44%) |
17.55 |
15.91 - 18.48 |
0.8311 times |
Fri 28 November 2025 |
17.57 (-6.39%) |
17.84 |
17.08 - 19.06 |
0.8281 times |
Fri 21 November 2025 |
18.77 (0.7%) |
19.39 |
17.25 - 19.39 |
1.4103 times |
Fri 14 November 2025 |
18.64 (10.43%) |
16.88 |
16.04 - 20.11 |
3.7694 times |
Fri 07 November 2025 |
16.88 (3.3%) |
16.50 |
16.10 - 17.69 |
0.6428 times |
Fri 31 October 2025 |
16.34 (-5.44%) |
17.72 |
15.35 - 17.72 |
0.6928 times |
Thu 23 October 2025 |
17.28 (5.05%) |
17.27 |
15.64 - 17.29 |
0.3464 times |
Fri 17 October 2025 |
16.45 (2.88%) |
16.78 |
15.58 - 17.61 |
0.9119 times |
Fri 10 October 2025 |
15.99 (1.91%) |
15.69 |
14.78 - 15.99 |
0.3967 times |
Fri 03 October 2025 |
15.69 (-3.92%) |
16.01 |
15.69 - 16.33 |
0.1704 times |
Fri 26 September 2025 |
16.33 (-3.94%) |
16.66 |
16.01 - 17.68 |
1.1792 times |
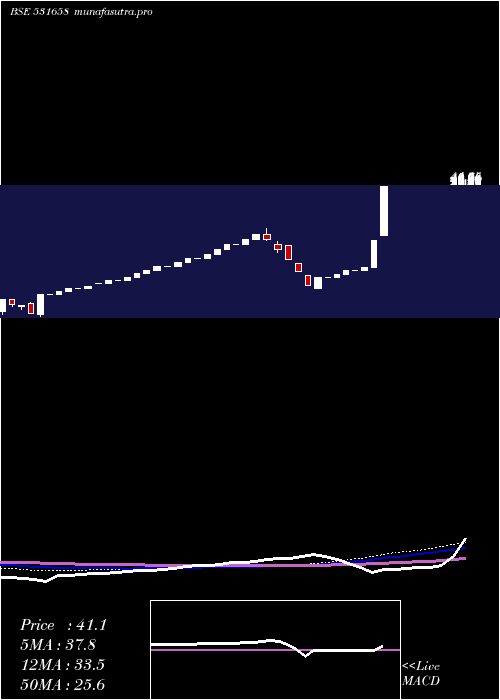
Monthly price and charts TrijalInd Strong monthly Stock price targets for TrijalInd 531658 are 17.13 and 19.7 | Monthly Target 1 | 15.01 | | Monthly Target 2 | 16.68 | | Monthly Target 3 | 17.58 | | Monthly Target 4 | 19.25 | | Monthly Target 5 | 20.15 |
Monthly price and volumes Trijal Ind
| Date |
Closing |
Open |
Range |
Volume |
Fri 05 December 2025 |
18.35 (4.44%) |
17.55 |
15.91 - 18.48 |
0.3223 times |
Fri 28 November 2025 |
17.57 (7.53%) |
16.50 |
16.04 - 20.11 |
2.5786 times |
Fri 31 October 2025 |
16.34 (0.06%) |
16.33 |
14.78 - 17.72 |
0.9509 times |
Tue 30 September 2025 |
16.33 (0.31%) |
15.47 |
15.47 - 20.75 |
2.1853 times |
Fri 29 August 2025 |
16.28 (-35.42%) |
25.71 |
16.28 - 26.20 |
1.1091 times |
Thu 31 July 2025 |
25.21 (-6.77%) |
28.39 |
25.21 - 50.53 |
2.7067 times |
Mon 30 June 2025 |
27.04 (33.86%) |
20.20 |
20.20 - 27.04 |
0.0195 times |
Mon 26 May 2025 |
20.20 (4.99%) |
19.24 |
19.24 - 20.20 |
0.0722 times |
Mon 28 April 2025 |
19.24 (0%) |
19.24 |
19.24 - 19.24 |
0.0156 times |
Mon 24 March 2025 |
19.24 (4.96%) |
18.33 |
18.33 - 19.24 |
0.0399 times |
Mon 17 February 2025 |
18.33 (4.98%) |
17.46 |
17.46 - 18.33 |
0.008 times |
DMA SMA EMA moving averages of Trijal Ind 531658
DMA (daily moving average) of Trijal Ind 531658
| DMA period | DMA value | | 5 day DMA | 17.47 | | 12 day DMA | 17.94 | | 20 day DMA | 18.01 | | 35 day DMA | 17.46 | | 50 day DMA | 17.06 | | 100 day DMA | 22.6 | | 150 day DMA | 22.35 | | 200 day DMA | 22.84 | EMA (exponential moving average) of Trijal Ind 531658
| EMA period | EMA current | EMA prev | EMA prev2 | | 5 day EMA | 17.81 | 17.54 | 17.39 | | 12 day EMA | 17.8 | 17.7 | 17.67 | | 20 day EMA | 17.74 | 17.68 | 17.66 | | 35 day EMA | 17.51 | 17.46 | 17.44 | | 50 day EMA | 17.16 | 17.11 | 17.08 |
SMA (simple moving average) of Trijal Ind 531658
| SMA period | SMA current | SMA prev | SMA prev2 | | 5 day SMA | 17.47 | 17.31 | 17.34 | | 12 day SMA | 17.94 | 17.91 | 17.92 | | 20 day SMA | 18.01 | 17.94 | 17.91 | | 35 day SMA | 17.46 | 17.41 | 17.36 | | 50 day SMA | 17.06 | 17.03 | 17.02 | | 100 day SMA | 22.6 | 22.77 | 22.94 | | 150 day SMA | 22.35 | 22.4 | 22.45 | | 200 day SMA | 22.84 | 22.84 | 22.85 |
|
|
