GoraniIndus 531608 full analysis,charts,indicators,moving averages,SMA,DMA,EMA,ADX,MACD,RSIGorani Indus 531608 WideScreen charts, DMA,SMA,EMA technical analysis, forecast prediction, by indicators ADX,MACD,RSI,CCI BSE stock exchange
Daily price and charts and targets GoraniIndus Strong Daily Stock price targets for GoraniIndus 531608 are 67.15 and 69.05 | Daily Target 1 | 66.83 | | Daily Target 2 | 67.47 | | Daily Target 3 | 68.733333333333 | | Daily Target 4 | 69.37 | | Daily Target 5 | 70.63 |
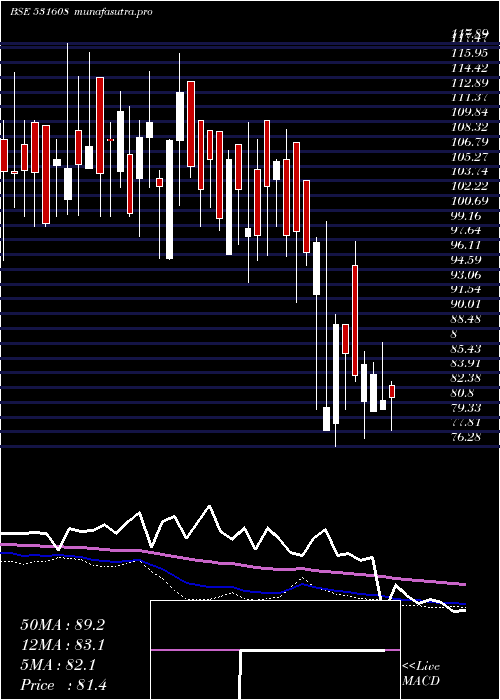
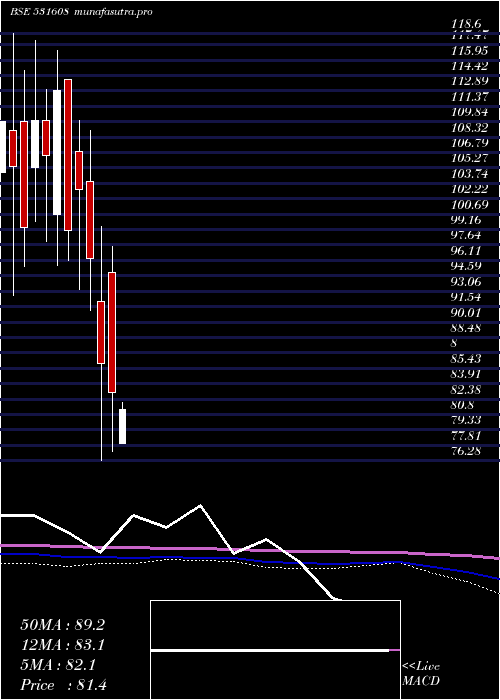
Daily price and volume Gorani Indus
| Date |
Closing |
Open |
Range |
Volume |
Tue 21 October 2025 |
68.10 (-3.32%) |
70.00 |
68.10 - 70.00 |
0.014 times |
Mon 20 October 2025 |
70.44 (1.73%) |
68.60 |
67.51 - 70.88 |
2.6129 times |
Fri 17 October 2025 |
69.24 (-2.26%) |
70.89 |
67.55 - 70.89 |
0.1666 times |
Thu 16 October 2025 |
70.84 (1.53%) |
69.77 |
69.00 - 70.96 |
0.6997 times |
Wed 15 October 2025 |
69.77 (2.6%) |
68.50 |
68.00 - 69.83 |
0.1997 times |
Tue 14 October 2025 |
68.00 (-3.6%) |
67.21 |
67.02 - 69.00 |
2.3674 times |
Mon 13 October 2025 |
70.54 (-0.66%) |
67.46 |
67.46 - 70.54 |
0.5292 times |
Fri 10 October 2025 |
71.01 (-4.67%) |
71.10 |
71.01 - 72.99 |
1.8458 times |
Thu 09 October 2025 |
74.49 (-0.55%) |
71.50 |
71.16 - 74.49 |
1.5634 times |
Wed 08 October 2025 |
74.90 (-0.03%) |
74.90 |
74.90 - 74.90 |
0.0013 times |
Tue 07 October 2025 |
74.92 (-0.05%) |
72.00 |
71.41 - 74.92 |
0.4694 times |

Weekly price and charts GoraniIndus Strong weekly Stock price targets for GoraniIndus 531608 are 66.12 and 69.49 | Weekly Target 1 | 65.46 | | Weekly Target 2 | 66.78 | | Weekly Target 3 | 68.83 | | Weekly Target 4 | 70.15 | | Weekly Target 5 | 72.2 |
Weekly price and volumes for Gorani Indus
| Date |
Closing |
Open |
Range |
Volume |
Tue 21 October 2025 |
68.10 (-1.65%) |
68.60 |
67.51 - 70.88 |
0.1351 times |
Fri 17 October 2025 |
69.24 (-2.49%) |
67.46 |
67.02 - 70.96 |
0.2038 times |
Fri 10 October 2025 |
71.01 (-5.27%) |
72.00 |
71.01 - 74.92 |
0.1996 times |
Fri 03 October 2025 |
74.96 (5.28%) |
70.00 |
69.10 - 75.69 |
0.1507 times |
Fri 26 September 2025 |
71.20 (-2.93%) |
73.00 |
71.20 - 76.40 |
0.1438 times |
Fri 19 September 2025 |
73.35 (-1.21%) |
74.10 |
70.20 - 75.00 |
0.1534 times |
Fri 12 September 2025 |
74.25 (-5.65%) |
82.40 |
70.20 - 82.40 |
0.3943 times |
Fri 05 September 2025 |
78.70 (-31.35%) |
119.80 |
78.70 - 126.10 |
3.3716 times |
Fri 29 August 2025 |
114.64 (50.84%) |
74.00 |
66.20 - 114.64 |
5.22 times |
Fri 22 August 2025 |
76.00 (1.67%) |
69.95 |
63.80 - 78.70 |
0.0277 times |
Thu 14 August 2025 |
74.75 (-0.33%) |
69.40 |
65.65 - 74.77 |
0.0356 times |
Monthly price and charts GoraniIndus Strong monthly Stock price targets for GoraniIndus 531608 are 63.23 and 71.9 | Monthly Target 1 | 61.6 | | Monthly Target 2 | 64.85 | | Monthly Target 3 | 70.27 | | Monthly Target 4 | 73.52 | | Monthly Target 5 | 78.94 |
Monthly price and volumes Gorani Indus
| Date |
Closing |
Open |
Range |
Volume |
Tue 21 October 2025 |
68.10 (-8.84%) |
71.05 |
67.02 - 75.69 |
0.4027 times |
Tue 30 September 2025 |
74.70 (-34.84%) |
119.80 |
69.10 - 126.10 |
2.9551 times |
Fri 29 August 2025 |
114.64 (57.84%) |
68.00 |
63.80 - 114.64 |
3.8281 times |
Thu 31 July 2025 |
72.63 (2.88%) |
73.00 |
63.79 - 76.27 |
0.2296 times |
Mon 30 June 2025 |
70.60 (-15.45%) |
83.00 |
68.10 - 84.00 |
0.6527 times |
Fri 30 May 2025 |
83.50 (0.61%) |
78.00 |
78.00 - 88.00 |
0.1405 times |
Tue 29 April 2025 |
82.99 (-3.38%) |
94.95 |
77.15 - 97.50 |
0.1243 times |
Fri 28 March 2025 |
85.89 (-10.81%) |
92.00 |
76.28 - 99.50 |
0.517 times |
Fri 28 February 2025 |
96.30 (-6.6%) |
103.90 |
91.15 - 109.00 |
0.6623 times |
Fri 31 January 2025 |
103.10 (4.09%) |
106.90 |
93.25 - 110.00 |
0.4877 times |
Tue 31 December 2024 |
99.05 (-12.27%) |
114.00 |
96.10 - 114.00 |
0.5357 times |
DMA SMA EMA moving averages of Gorani Indus 531608
DMA (daily moving average) of Gorani Indus 531608
| DMA period | DMA value | | 5 day DMA | 69.68 | | 12 day DMA | 71.43 | | 20 day DMA | 72.56 | | 35 day DMA | 75.32 | | 50 day DMA | 76.14 | | 100 day DMA | 76 | | 150 day DMA | 79.44 | | 200 day DMA | 84.82 | EMA (exponential moving average) of Gorani Indus 531608
| EMA period | EMA current | EMA prev | EMA prev2 | | 5 day EMA | 69.55 | 70.27 | 70.19 | | 12 day EMA | 70.93 | 71.44 | 71.62 | | 20 day EMA | 72.07 | 72.49 | 72.71 | | 35 day EMA | 73.73 | 74.06 | 74.27 | | 50 day EMA | 75.19 | 75.48 | 75.69 |
SMA (simple moving average) of Gorani Indus 531608
| SMA period | SMA current | SMA prev | SMA prev2 | | 5 day SMA | 69.68 | 69.66 | 69.68 | | 12 day SMA | 71.43 | 72.06 | 72.41 | | 20 day SMA | 72.56 | 72.82 | 72.84 | | 35 day SMA | 75.32 | 76.65 | 77.36 | | 50 day SMA | 76.14 | 76.14 | 76.19 | | 100 day SMA | 76 | 76.17 | 76.28 | | 150 day SMA | 79.44 | 79.64 | 79.79 | | 200 day SMA | 84.82 | 84.99 | 85.18 |
|
|
