OrientTrade 531512 full analysis,charts,indicators,moving averages,SMA,DMA,EMA,ADX,MACD,RSIOrient Trade 531512 WideScreen charts, DMA,SMA,EMA technical analysis, forecast prediction, by indicators ADX,MACD,RSI,CCI BSE stock exchange
Daily price and charts and targets OrientTrade Strong Daily Stock price targets for OrientTrade 531512 are 21.67 and 23.46 | Daily Target 1 | 21.31 | | Daily Target 2 | 22.02 | | Daily Target 3 | 23.103333333333 | | Daily Target 4 | 23.81 | | Daily Target 5 | 24.89 |
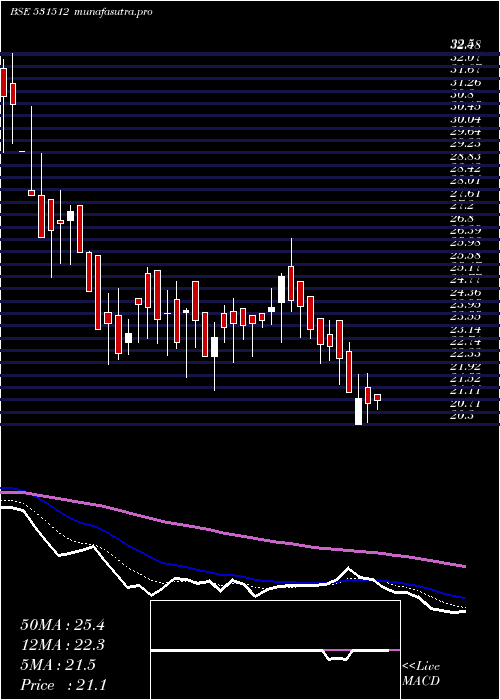
Daily price and volume Orient Trade
| Date |
Closing |
Open |
Range |
Volume |
Thu 23 October 2025 |
22.72 (-3.11%) |
23.99 |
22.40 - 24.19 |
0.1828 times |
Tue 21 October 2025 |
23.45 (-0.97%) |
24.25 |
23.00 - 24.35 |
0.1014 times |
Mon 20 October 2025 |
23.68 (0.47%) |
24.39 |
22.70 - 24.39 |
0.3622 times |
Fri 17 October 2025 |
23.57 (1.25%) |
23.70 |
23.40 - 24.39 |
0.8519 times |
Thu 16 October 2025 |
23.28 (-0.85%) |
23.99 |
22.91 - 23.99 |
0.286 times |
Wed 15 October 2025 |
23.48 (-2.09%) |
24.45 |
22.95 - 24.45 |
2.8115 times |
Tue 14 October 2025 |
23.98 (0.38%) |
24.12 |
22.81 - 24.74 |
1.6861 times |
Mon 13 October 2025 |
23.89 (1.36%) |
24.00 |
22.87 - 24.50 |
1.8891 times |
Fri 10 October 2025 |
23.57 (0.38%) |
23.70 |
22.01 - 24.50 |
0.585 times |
Thu 09 October 2025 |
23.48 (6.24%) |
22.90 |
22.10 - 24.00 |
1.2439 times |
Wed 08 October 2025 |
22.10 (-0.05%) |
23.59 |
20.00 - 23.59 |
0.3316 times |
Weekly price and charts OrientTrade Strong weekly Stock price targets for OrientTrade 531512 are 21.57 and 23.56 | Weekly Target 1 | 21.18 | | Weekly Target 2 | 21.95 | | Weekly Target 3 | 23.17 | | Weekly Target 4 | 23.94 | | Weekly Target 5 | 25.16 |
Weekly price and volumes for Orient Trade
| Date |
Closing |
Open |
Range |
Volume |
Thu 23 October 2025 |
22.72 (-3.61%) |
24.39 |
22.40 - 24.39 |
0.2254 times |
Fri 17 October 2025 |
23.57 (0%) |
24.00 |
22.81 - 24.74 |
2.6239 times |
Fri 10 October 2025 |
23.57 (9.63%) |
21.80 |
20.00 - 24.50 |
1.1548 times |
Fri 03 October 2025 |
21.50 (6.75%) |
20.80 |
18.98 - 21.50 |
1.0668 times |
Fri 26 September 2025 |
20.14 (4.51%) |
19.60 |
18.60 - 20.79 |
0.8127 times |
Fri 19 September 2025 |
19.27 (1.74%) |
19.48 |
18.20 - 20.85 |
1.0532 times |
Fri 12 September 2025 |
18.94 (8.85%) |
17.85 |
17.00 - 21.88 |
0.7073 times |
Fri 05 September 2025 |
17.40 (-12.83%) |
20.70 |
16.21 - 20.70 |
1.0601 times |
Fri 29 August 2025 |
19.96 (-5.45%) |
22.30 |
18.83 - 22.30 |
0.4481 times |
Fri 22 August 2025 |
21.11 (-9.01%) |
24.20 |
20.56 - 24.30 |
0.8476 times |
Thu 14 August 2025 |
23.20 (5.45%) |
22.00 |
21.26 - 24.78 |
0.229 times |

Monthly price and charts OrientTrade Strong monthly Stock price targets for OrientTrade 531512 are 20.85 and 26.61 | Monthly Target 1 | 16.39 | | Monthly Target 2 | 19.55 | | Monthly Target 3 | 22.146666666667 | | Monthly Target 4 | 25.31 | | Monthly Target 5 | 27.91 |
Monthly price and volumes Orient Trade
| Date |
Closing |
Open |
Range |
Volume |
Thu 23 October 2025 |
22.72 (14.11%) |
21.42 |
18.98 - 24.74 |
1.3908 times |
Tue 30 September 2025 |
19.91 (-0.25%) |
20.70 |
16.21 - 21.88 |
1.0754 times |
Fri 29 August 2025 |
19.96 (-13.07%) |
23.30 |
18.83 - 24.78 |
0.637 times |
Thu 31 July 2025 |
22.96 (-0.91%) |
23.48 |
22.10 - 26.35 |
1.5646 times |
Mon 30 June 2025 |
23.17 (28.58%) |
18.50 |
16.27 - 26.68 |
2.3614 times |
Fri 30 May 2025 |
18.02 (-14.56%) |
22.00 |
17.51 - 23.17 |
1.0638 times |
Wed 30 April 2025 |
21.09 (-10.26%) |
24.00 |
20.30 - 26.43 |
0.442 times |
Fri 28 March 2025 |
23.50 (-11.95%) |
27.00 |
21.42 - 28.00 |
0.5918 times |
Fri 28 February 2025 |
26.69 (-21.89%) |
35.00 |
25.12 - 37.00 |
0.5989 times |
Fri 31 January 2025 |
34.17 (-5.27%) |
36.35 |
34.17 - 39.38 |
0.2744 times |
Tue 31 December 2024 |
36.07 (89.54%) |
19.98 |
19.98 - 36.07 |
1.1655 times |

DMA SMA EMA moving averages of Orient Trade 531512
DMA (daily moving average) of Orient Trade 531512
| DMA period | DMA value | | 5 day DMA | 23.34 | | 12 day DMA | 23.28 | | 20 day DMA | 22.08 | | 35 day DMA | 20.79 | | 50 day DMA | 20.9 | | 100 day DMA | 21.61 | | 150 day DMA | 21.76 | | 200 day DMA | 24.88 | EMA (exponential moving average) of Orient Trade 531512
| EMA period | EMA current | EMA prev | EMA prev2 | | 5 day EMA | 23.24 | 23.5 | 23.52 | | 12 day EMA | 22.92 | 22.96 | 22.87 | | 20 day EMA | 22.37 | 22.33 | 22.21 | | 35 day EMA | 21.85 | 21.8 | 21.7 | | 50 day EMA | 21.24 | 21.18 | 21.09 |
SMA (simple moving average) of Orient Trade 531512
| SMA period | SMA current | SMA prev | SMA prev2 | | 5 day SMA | 23.34 | 23.49 | 23.6 | | 12 day SMA | 23.28 | 23.23 | 23.07 | | 20 day SMA | 22.08 | 21.91 | 21.69 | | 35 day SMA | 20.79 | 20.66 | 20.51 | | 50 day SMA | 20.9 | 20.88 | 20.85 | | 100 day SMA | 21.61 | 21.56 | 21.51 | | 150 day SMA | 21.76 | 21.77 | 21.79 | | 200 day SMA | 24.88 | 24.94 | 25 |
|
|
