BostonBio 531458 full analysis,charts,indicators,moving averages,SMA,DMA,EMA,ADX,MACD,RSIBoston Bio 531458 WideScreen charts, DMA,SMA,EMA technical analysis, forecast prediction, by indicators ADX,MACD,RSI,CCI BSE stock exchange
Daily price and charts and targets BostonBio Strong Daily Stock price targets for BostonBio 531458 are 7.7 and 7.71 | Daily Target 1 | 7.69 | | Daily Target 2 | 7.7 | | Daily Target 3 | 7.7033333333333 | | Daily Target 4 | 7.71 | | Daily Target 5 | 7.71 |
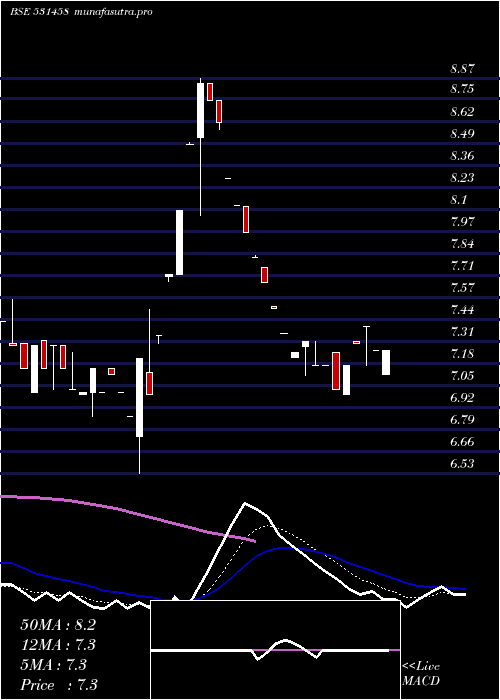
Daily price and volume Boston Bio
| Date |
Closing |
Open |
Range |
Volume |
Thu 23 October 2025 |
7.70 (-3.63%) |
7.71 |
7.70 - 7.71 |
0.6198 times |
Mon 20 October 2025 |
7.99 (4.86%) |
7.65 |
7.65 - 8.00 |
1.0169 times |
Fri 17 October 2025 |
7.62 (0.13%) |
7.61 |
7.61 - 7.62 |
0.0743 times |
Thu 16 October 2025 |
7.61 (-0.26%) |
7.67 |
7.61 - 7.67 |
0.2055 times |
Wed 15 October 2025 |
7.63 (-4.98%) |
7.80 |
7.63 - 7.80 |
3.1158 times |
Tue 14 October 2025 |
8.03 (-4.97%) |
8.06 |
8.03 - 8.25 |
0.9476 times |
Mon 13 October 2025 |
8.45 (3.17%) |
8.50 |
8.45 - 8.50 |
0.273 times |
Fri 10 October 2025 |
8.19 (-4.99%) |
9.05 |
8.19 - 9.05 |
1.7726 times |
Thu 09 October 2025 |
8.62 (-4.96%) |
9.52 |
8.62 - 9.52 |
1.202 times |
Wed 08 October 2025 |
9.07 (4.73%) |
9.07 |
9.00 - 9.09 |
0.7726 times |
Tue 07 October 2025 |
8.66 (-3.78%) |
9.04 |
8.65 - 9.44 |
2.742 times |
Weekly price and charts BostonBio Strong weekly Stock price targets for BostonBio 531458 are 7.68 and 8.03 | Weekly Target 1 | 7.43 | | Weekly Target 2 | 7.57 | | Weekly Target 3 | 7.7833333333333 | | Weekly Target 4 | 7.92 | | Weekly Target 5 | 8.13 |
Weekly price and volumes for Boston Bio
| Date |
Closing |
Open |
Range |
Volume |
Thu 23 October 2025 |
7.70 (1.05%) |
7.65 |
7.65 - 8.00 |
0.3432 times |
Fri 17 October 2025 |
7.62 (-6.96%) |
8.50 |
7.61 - 8.50 |
0.968 times |
Fri 10 October 2025 |
8.19 (-7.67%) |
9.31 |
8.19 - 9.52 |
1.8358 times |
Fri 03 October 2025 |
8.87 (3.14%) |
8.56 |
7.77 - 9.00 |
3.3054 times |
Fri 26 September 2025 |
8.60 (9.97%) |
8.15 |
7.45 - 8.79 |
0.7555 times |
Fri 19 September 2025 |
7.82 (-0.38%) |
8.23 |
7.57 - 8.55 |
0.6804 times |
Fri 12 September 2025 |
7.85 (-8.61%) |
8.93 |
7.85 - 8.93 |
0.5091 times |
Fri 05 September 2025 |
8.59 (-3.27%) |
8.45 |
8.05 - 9.29 |
0.8456 times |
Fri 29 August 2025 |
8.88 (11.56%) |
8.35 |
7.57 - 9.25 |
0.3248 times |
Fri 22 August 2025 |
7.96 (0.76%) |
7.51 |
7.26 - 8.18 |
0.4322 times |
Thu 14 August 2025 |
7.90 (-2.47%) |
8.10 |
7.36 - 8.10 |
0.3414 times |

Monthly price and charts BostonBio Strong monthly Stock price targets for BostonBio 531458 are 6.7 and 8.61 | Monthly Target 1 | 6.37 | | Monthly Target 2 | 7.03 | | Monthly Target 3 | 8.2766666666667 | | Monthly Target 4 | 8.94 | | Monthly Target 5 | 10.19 |
Monthly price and volumes Boston Bio
| Date |
Closing |
Open |
Range |
Volume |
Thu 23 October 2025 |
7.70 (-4.35%) |
8.45 |
7.61 - 9.52 |
1.6643 times |
Tue 30 September 2025 |
8.05 (-9.35%) |
8.45 |
7.45 - 9.29 |
0.7614 times |
Fri 29 August 2025 |
8.88 (18.56%) |
7.50 |
7.05 - 9.25 |
0.4685 times |
Thu 31 July 2025 |
7.49 (-2.22%) |
7.52 |
6.84 - 7.88 |
1.726 times |
Mon 30 June 2025 |
7.66 (7.13%) |
7.01 |
6.53 - 8.87 |
0.5335 times |
Fri 30 May 2025 |
7.15 (-17.82%) |
8.70 |
6.87 - 8.70 |
1.2287 times |
Wed 30 April 2025 |
8.70 (-46.26%) |
15.39 |
6.84 - 15.39 |
1.5672 times |
Fri 28 March 2025 |
16.19 (0%) |
20.10 |
16.19 - 20.10 |
0.0504 times |
Thu 23 October 2025 |
(0%) |
|
- |
0 times |

DMA SMA EMA moving averages of Boston Bio 531458
DMA (daily moving average) of Boston Bio 531458
| DMA period | DMA value | | 5 day DMA | 7.71 | | 12 day DMA | 8.21 | | 20 day DMA | 8.27 | | 35 day DMA | 8.24 | | 50 day DMA | 8.22 | | 100 day DMA | 7.84 | | 150 day DMA | | | 200 day DMA | | EMA (exponential moving average) of Boston Bio 531458
| EMA period | EMA current | EMA prev | EMA prev2 | | 5 day EMA | 7.83 | 7.89 | 7.84 | | 12 day EMA | 8.02 | 8.08 | 8.1 | | 20 day EMA | 8.12 | 8.16 | 8.18 | | 35 day EMA | 8.16 | 8.19 | 8.2 | | 50 day EMA | 8.12 | 8.14 | 8.15 |
SMA (simple moving average) of Boston Bio 531458
| SMA period | SMA current | SMA prev | SMA prev2 | | 5 day SMA | 7.71 | 7.78 | 7.87 | | 12 day SMA | 8.21 | 8.31 | 8.35 | | 20 day SMA | 8.27 | 8.27 | 8.26 | | 35 day SMA | 8.24 | 8.28 | 8.3 | | 50 day SMA | 8.22 | 8.22 | 8.21 | | 100 day SMA | 7.84 | 7.84 | 7.83 | | 150 day SMA | | 200 day SMA |
|
|
