GoldstoneEn 531439 full analysis,charts,indicators,moving averages,SMA,DMA,EMA,ADX,MACD,RSIGoldstone En 531439 WideScreen charts, DMA,SMA,EMA technical analysis, forecast prediction, by indicators ADX,MACD,RSI,CCI BSE stock exchange
Daily price and charts and targets GoldstoneEn Strong Daily Stock price targets for GoldstoneEn 531439 are 51.95 and 57.4 | Daily Target 1 | 50.58 | | Daily Target 2 | 53.31 | | Daily Target 3 | 56.026666666667 | | Daily Target 4 | 58.76 | | Daily Target 5 | 61.48 |
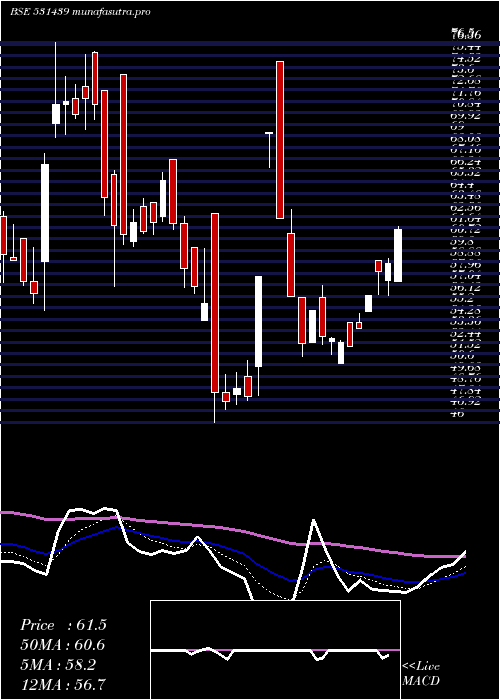
Daily price and volume Goldstone En
| Date |
Closing |
Open |
Range |
Volume |
Tue 21 October 2025 |
56.05 (-2.2%) |
58.74 |
53.29 - 58.74 |
0.5577 times |
Mon 20 October 2025 |
57.31 (0.88%) |
60.00 |
56.00 - 60.00 |
0.7019 times |
Fri 17 October 2025 |
56.81 (-4.5%) |
59.12 |
55.89 - 60.28 |
0.8034 times |
Thu 16 October 2025 |
59.49 (-0.12%) |
60.30 |
59.40 - 60.46 |
0.3497 times |
Wed 15 October 2025 |
59.56 (-1.88%) |
62.62 |
55.11 - 62.62 |
2.2389 times |
Tue 14 October 2025 |
60.70 (1%) |
60.40 |
59.00 - 61.30 |
0.6963 times |
Mon 13 October 2025 |
60.10 (-1.77%) |
61.18 |
60.00 - 61.18 |
0.0549 times |
Fri 10 October 2025 |
61.18 (0.79%) |
60.98 |
59.75 - 64.88 |
0.9065 times |
Thu 09 October 2025 |
60.70 (0.33%) |
60.11 |
59.20 - 61.14 |
0.3767 times |
Wed 08 October 2025 |
60.50 (-3.17%) |
62.87 |
60.45 - 64.00 |
3.314 times |
Tue 07 October 2025 |
62.48 (-1.73%) |
62.95 |
62.13 - 64.35 |
0.1867 times |
Weekly price and charts GoldstoneEn Strong weekly Stock price targets for GoldstoneEn 531439 are 51.32 and 58.03 | Weekly Target 1 | 49.74 | | Weekly Target 2 | 52.89 | | Weekly Target 3 | 56.446666666667 | | Weekly Target 4 | 59.6 | | Weekly Target 5 | 63.16 |
Weekly price and volumes for Goldstone En
| Date |
Closing |
Open |
Range |
Volume |
Tue 21 October 2025 |
56.05 (-1.34%) |
60.00 |
53.29 - 60.00 |
0.1946 times |
Fri 17 October 2025 |
56.81 (-7.14%) |
61.18 |
55.11 - 62.62 |
0.6402 times |
Fri 10 October 2025 |
61.18 (-3.88%) |
67.00 |
59.20 - 67.00 |
1.1428 times |
Fri 03 October 2025 |
63.65 (3.21%) |
62.55 |
58.92 - 64.00 |
0.2441 times |
Fri 26 September 2025 |
61.67 (-9.28%) |
67.50 |
61.05 - 69.75 |
2.9746 times |
Fri 19 September 2025 |
67.98 (1.34%) |
68.75 |
65.00 - 71.80 |
1.1775 times |
Fri 12 September 2025 |
67.08 (0.12%) |
67.74 |
65.95 - 70.00 |
0.998 times |
Fri 05 September 2025 |
67.00 (0.68%) |
70.70 |
66.31 - 72.00 |
0.7827 times |
Fri 29 August 2025 |
66.55 (-4.29%) |
72.00 |
66.00 - 72.00 |
0.7458 times |
Fri 22 August 2025 |
69.53 (-0.29%) |
69.35 |
69.00 - 76.86 |
1.0998 times |
Thu 14 August 2025 |
69.73 (-4.27%) |
72.84 |
67.00 - 72.84 |
1.1356 times |

Monthly price and charts GoldstoneEn Strong monthly Stock price targets for GoldstoneEn 531439 are 47.82 and 61.53 | Monthly Target 1 | 45.07 | | Monthly Target 2 | 50.56 | | Monthly Target 3 | 58.78 | | Monthly Target 4 | 64.27 | | Monthly Target 5 | 72.49 |
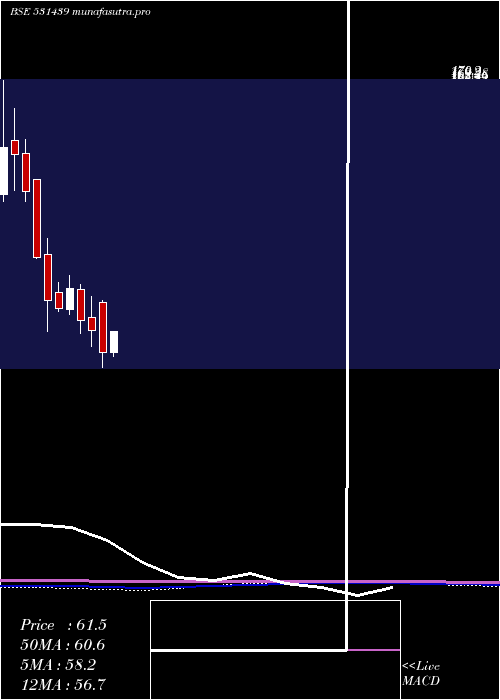
Monthly price and volumes Goldstone En
| Date |
Closing |
Open |
Range |
Volume |
Tue 21 October 2025 |
56.05 (-8.77%) |
61.20 |
53.29 - 67.00 |
0.4351 times |
Tue 30 September 2025 |
61.44 (-7.68%) |
70.70 |
60.88 - 72.00 |
1.2188 times |
Fri 29 August 2025 |
66.55 (-12.96%) |
79.69 |
66.00 - 80.50 |
0.9764 times |
Thu 31 July 2025 |
76.46 (2.37%) |
76.00 |
64.25 - 80.01 |
1.5514 times |
Mon 30 June 2025 |
74.69 (6.7%) |
70.13 |
63.20 - 77.98 |
1.0148 times |
Fri 30 May 2025 |
70.00 (8.24%) |
65.00 |
57.50 - 78.87 |
0.7196 times |
Wed 30 April 2025 |
64.67 (23.51%) |
52.40 |
50.74 - 69.66 |
0.6292 times |
Fri 28 March 2025 |
52.36 (-15.28%) |
73.90 |
46.00 - 75.00 |
2.2297 times |
Fri 28 February 2025 |
61.80 (-7.05%) |
67.80 |
55.00 - 76.50 |
0.8911 times |
Fri 31 January 2025 |
66.49 (-16.88%) |
79.90 |
60.80 - 82.00 |
0.3337 times |
Tue 31 December 2024 |
79.99 (11.95%) |
71.00 |
69.01 - 86.00 |
0.4906 times |
DMA SMA EMA moving averages of Goldstone En 531439
DMA (daily moving average) of Goldstone En 531439
| DMA period | DMA value | | 5 day DMA | 57.84 | | 12 day DMA | 59.87 | | 20 day DMA | 61.29 | | 35 day DMA | 63.86 | | 50 day DMA | 65.6 | | 100 day DMA | 68.31 | | 150 day DMA | 66.02 | | 200 day DMA | 66.58 | EMA (exponential moving average) of Goldstone En 531439
| EMA period | EMA current | EMA prev | EMA prev2 | | 5 day EMA | 57.66 | 58.46 | 59.03 | | 12 day EMA | 59.47 | 60.09 | 60.6 | | 20 day EMA | 61.03 | 61.55 | 62 | | 35 day EMA | 63.3 | 63.73 | 64.11 | | 50 day EMA | 65.54 | 65.93 | 66.28 |
SMA (simple moving average) of Goldstone En 531439
| SMA period | SMA current | SMA prev | SMA prev2 | | 5 day SMA | 57.84 | 58.77 | 59.33 | | 12 day SMA | 59.87 | 60.51 | 60.79 | | 20 day SMA | 61.29 | 61.85 | 62.39 | | 35 day SMA | 63.86 | 64.18 | 64.45 | | 50 day SMA | 65.6 | 65.9 | 66.22 | | 100 day SMA | 68.31 | 68.46 | 68.59 | | 150 day SMA | 66.02 | 66.06 | 66.09 | | 200 day SMA | 66.58 | 66.69 | 66.81 |
|
|
