SaffronInd 531436 full analysis,charts,indicators,moving averages,SMA,DMA,EMA,ADX,MACD,RSISaffron Ind 531436 WideScreen charts, DMA,SMA,EMA technical analysis, forecast prediction, by indicators ADX,MACD,RSI,CCI BSE stock exchange
Daily price and charts and targets SaffronInd Strong Daily Stock price targets for SaffronInd 531436 are 60.93 and 60.93 | Daily Target 1 | 60.93 | | Daily Target 2 | 60.93 | | Daily Target 3 | 60.93 | | Daily Target 4 | 60.93 | | Daily Target 5 | 60.93 |
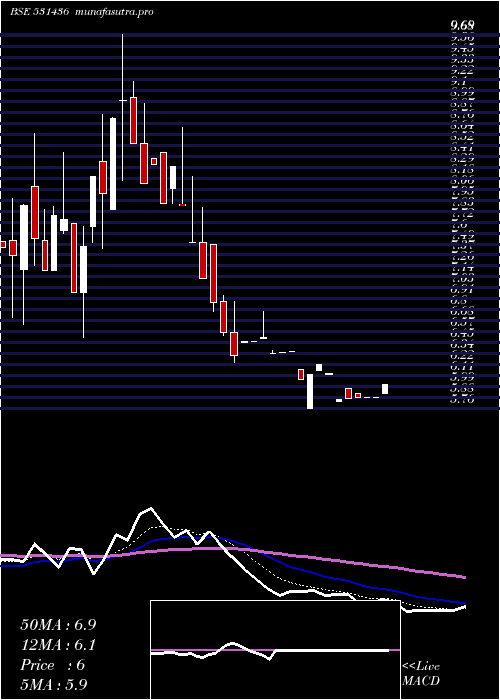
Daily price and volume Saffron Ind
| Date |
Closing |
Open |
Range |
Volume |
Tue 21 October 2025 |
60.93 (5%) |
60.93 |
60.93 - 60.93 |
0.1794 times |
Mon 20 October 2025 |
58.03 (4.99%) |
58.03 |
58.03 - 58.03 |
0.269 times |
Fri 17 October 2025 |
55.27 (5%) |
55.27 |
55.27 - 55.27 |
0.9427 times |
Thu 16 October 2025 |
52.64 (4.99%) |
52.64 |
52.64 - 52.64 |
0.4364 times |
Wed 15 October 2025 |
50.14 (4.98%) |
50.14 |
50.14 - 50.14 |
0.7227 times |
Tue 14 October 2025 |
47.76 (4.99%) |
47.76 |
46.40 - 47.76 |
0.878 times |
Mon 13 October 2025 |
45.49 (4.57%) |
41.33 |
41.33 - 45.67 |
2.6505 times |
Fri 10 October 2025 |
43.50 (5%) |
43.50 |
43.50 - 43.50 |
0.5288 times |
Thu 09 October 2025 |
41.43 (4.99%) |
41.43 |
37.55 - 41.43 |
0.7182 times |
Wed 08 October 2025 |
39.46 (4.78%) |
39.54 |
35.78 - 39.54 |
2.6742 times |
Tue 07 October 2025 |
37.66 (4.99%) |
37.66 |
34.08 - 37.66 |
2.1404 times |
Weekly price and charts SaffronInd Strong weekly Stock price targets for SaffronInd 531436 are 59.48 and 62.38 | Weekly Target 1 | 57.06 | | Weekly Target 2 | 59 | | Weekly Target 3 | 59.963333333333 | | Weekly Target 4 | 61.9 | | Weekly Target 5 | 62.86 |
Weekly price and volumes for Saffron Ind
| Date |
Closing |
Open |
Range |
Volume |
Tue 21 October 2025 |
60.93 (10.24%) |
58.03 |
58.03 - 60.93 |
0.1666 times |
Fri 17 October 2025 |
55.27 (27.06%) |
41.33 |
41.33 - 55.27 |
2.0912 times |
Fri 10 October 2025 |
43.50 (27.3%) |
35.87 |
34.08 - 43.50 |
2.3441 times |
Fri 03 October 2025 |
34.17 (9.94%) |
29.53 |
28.06 - 34.17 |
0.6238 times |
Fri 26 September 2025 |
31.08 (15.41%) |
28.27 |
28.27 - 34.34 |
1.9712 times |
Fri 19 September 2025 |
26.93 (4.5%) |
24.49 |
22.11 - 26.93 |
1.3176 times |
Fri 12 September 2025 |
25.77 (-9.07%) |
27.78 |
25.77 - 27.91 |
0.0211 times |
Fri 05 September 2025 |
28.34 (-9.51%) |
30.70 |
28.34 - 30.70 |
0.2746 times |
Fri 29 August 2025 |
31.32 (3.98%) |
30.72 |
30.72 - 31.95 |
0.8315 times |
Fri 22 August 2025 |
30.12 (10.29%) |
27.85 |
27.85 - 30.12 |
0.3584 times |
Thu 14 August 2025 |
27.31 (8.16%) |
25.75 |
25.75 - 27.31 |
0.4248 times |

Monthly price and charts SaffronInd Strong monthly Stock price targets for SaffronInd 531436 are 46.74 and 75.12 | Monthly Target 1 | 23.09 | | Monthly Target 2 | 42.01 | | Monthly Target 3 | 51.47 | | Monthly Target 4 | 70.39 | | Monthly Target 5 | 79.85 |
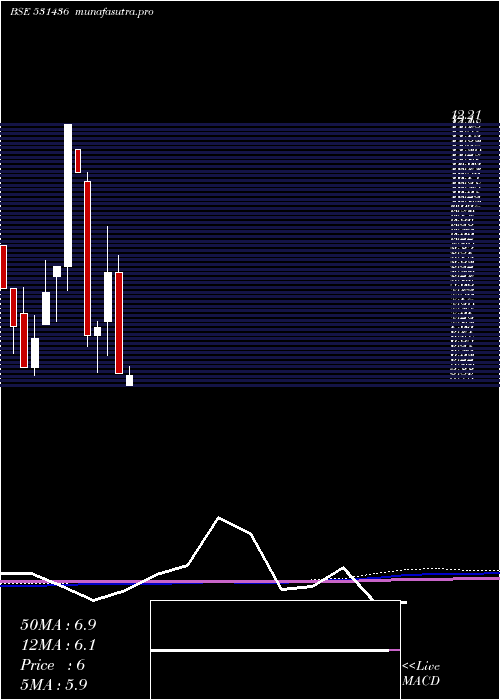
Monthly price and volumes Saffron Ind
| Date |
Closing |
Open |
Range |
Volume |
Tue 21 October 2025 |
60.93 (96.55%) |
32.55 |
32.55 - 60.93 |
2.005 times |
Tue 30 September 2025 |
31.00 (-1.02%) |
30.70 |
22.11 - 34.34 |
1.7509 times |
Fri 29 August 2025 |
31.32 (39.45%) |
22.90 |
22.90 - 31.95 |
0.8774 times |
Thu 31 July 2025 |
22.46 (69.38%) |
12.80 |
12.60 - 22.46 |
3.1225 times |
Mon 30 June 2025 |
13.26 (77.99%) |
7.82 |
7.82 - 14.64 |
1.18 times |
Fri 30 May 2025 |
7.45 (15.15%) |
6.47 |
5.90 - 7.45 |
0.0829 times |
Wed 30 April 2025 |
6.47 (6.77%) |
5.76 |
5.76 - 6.47 |
0.1237 times |
Fri 28 March 2025 |
6.06 (-29.12%) |
8.55 |
6.06 - 8.97 |
0.3001 times |
Fri 28 February 2025 |
8.55 (18.92%) |
7.33 |
6.50 - 9.69 |
0.4592 times |
Thu 30 January 2025 |
7.19 (2.71%) |
7.00 |
6.09 - 7.35 |
0.0982 times |
Tue 31 December 2024 |
7.00 (-36.48%) |
10.80 |
6.72 - 11.02 |
0.0822 times |
DMA SMA EMA moving averages of Saffron Ind 531436
DMA (daily moving average) of Saffron Ind 531436
| DMA period | DMA value | | 5 day DMA | 55.4 | | 12 day DMA | 47.35 | | 20 day DMA | 41 | | 35 day DMA | 34.97 | | 50 day DMA | 33.13 | | 100 day DMA | 24.17 | | 150 day DMA | 18.39 | | 200 day DMA | 15.8 | EMA (exponential moving average) of Saffron Ind 531436
| EMA period | EMA current | EMA prev | EMA prev2 | | 5 day EMA | 55.66 | 53.02 | 50.51 | | 12 day EMA | 48.81 | 46.61 | 44.53 | | 20 day EMA | 43.82 | 42.02 | 40.34 | | 35 day EMA | 38.83 | 37.53 | 36.32 | | 50 day EMA | 34.62 | 33.55 | 32.55 |
SMA (simple moving average) of Saffron Ind 531436
| SMA period | SMA current | SMA prev | SMA prev2 | | 5 day SMA | 55.4 | 52.77 | 50.26 | | 12 day SMA | 47.35 | 45.12 | 43 | | 20 day SMA | 41 | 39.37 | 37.82 | | 35 day SMA | 34.97 | 34.11 | 33.35 | | 50 day SMA | 33.13 | 32.4 | 31.73 | | 100 day SMA | 24.17 | 23.62 | 23.1 | | 150 day SMA | 18.39 | 18.03 | 17.69 | | 200 day SMA | 15.8 | 15.53 | 15.29 |
|
|
