EasternTred 531346 full analysis,charts,indicators,moving averages,SMA,DMA,EMA,ADX,MACD,RSIEastern Tred 531346 WideScreen charts, DMA,SMA,EMA technical analysis, forecast prediction, by indicators ADX,MACD,RSI,CCI BSE stock exchange
Daily price and charts and targets EasternTred Strong Daily Stock price targets for EasternTred 531346 are 30.49 and 34.48 | Daily Target 1 | 27.33 | | Daily Target 2 | 29.66 | | Daily Target 3 | 31.323333333333 | | Daily Target 4 | 33.65 | | Daily Target 5 | 35.31 |
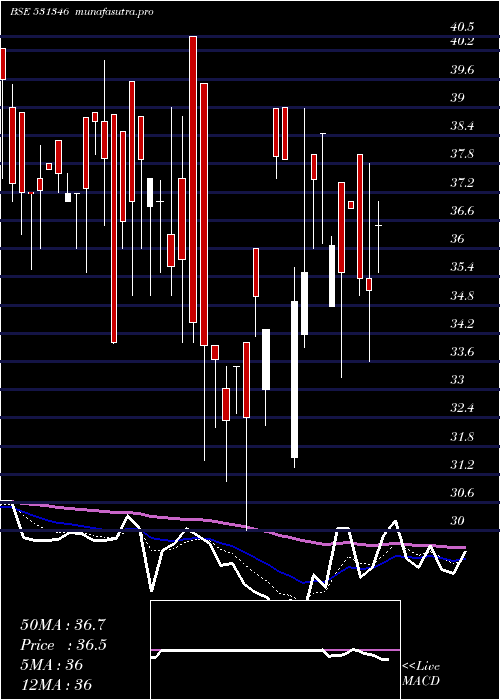
Daily price and volume Eastern Tred
| Date |
Closing |
Open |
Range |
Volume |
Fri 05 December 2025 |
31.98 (4.51%) |
29.00 |
29.00 - 32.99 |
0.3715 times |
Thu 04 December 2025 |
30.60 (-4.85%) |
30.10 |
30.00 - 31.50 |
1.5663 times |
Wed 03 December 2025 |
32.16 (-2.52%) |
32.32 |
30.00 - 32.32 |
0.1447 times |
Tue 02 December 2025 |
32.99 (3.32%) |
31.84 |
31.84 - 33.99 |
0.1193 times |
Mon 01 December 2025 |
31.93 (2.97%) |
31.00 |
29.50 - 32.00 |
1.537 times |
Fri 28 November 2025 |
31.01 (-1.49%) |
30.00 |
28.56 - 32.49 |
2.016 times |
Thu 27 November 2025 |
31.48 (4.93%) |
28.00 |
28.00 - 32.90 |
2.1001 times |
Wed 26 November 2025 |
30.00 (-3.23%) |
31.00 |
30.00 - 31.00 |
1.6484 times |
Tue 25 November 2025 |
31.00 (-2.82%) |
31.84 |
31.00 - 31.84 |
0.0548 times |
Mon 24 November 2025 |
31.90 (-1.97%) |
32.29 |
29.86 - 32.30 |
0.4419 times |
Fri 21 November 2025 |
32.54 (2.65%) |
31.48 |
31.00 - 32.99 |
3.6117 times |
Weekly price and charts EasternTred Strong weekly Stock price targets for EasternTred 531346 are 30.49 and 35.48 | Weekly Target 1 | 26.67 | | Weekly Target 2 | 29.32 | | Weekly Target 3 | 31.656666666667 | | Weekly Target 4 | 34.31 | | Weekly Target 5 | 36.65 |
Weekly price and volumes for Eastern Tred
| Date |
Closing |
Open |
Range |
Volume |
Fri 05 December 2025 |
31.98 (3.13%) |
31.00 |
29.00 - 33.99 |
0.3435 times |
Fri 28 November 2025 |
31.01 (-4.7%) |
32.29 |
28.00 - 32.90 |
0.5753 times |
Fri 21 November 2025 |
32.54 (0.65%) |
31.90 |
29.31 - 34.99 |
0.6017 times |
Fri 14 November 2025 |
32.33 (5.9%) |
29.00 |
29.00 - 32.50 |
0.3313 times |
Fri 07 November 2025 |
30.53 (-0.88%) |
30.60 |
28.50 - 31.49 |
1.817 times |
Fri 31 October 2025 |
30.80 (-0.55%) |
31.20 |
28.80 - 35.89 |
3.318 times |
Thu 23 October 2025 |
30.97 (-0.06%) |
30.99 |
28.96 - 31.30 |
0.2594 times |
Fri 17 October 2025 |
30.99 (4.13%) |
28.30 |
27.01 - 31.59 |
1.078 times |
Fri 10 October 2025 |
29.76 (-3.38%) |
30.79 |
28.30 - 30.79 |
0.6989 times |
Wed 01 October 2025 |
30.80 (1.78%) |
30.70 |
28.31 - 31.47 |
0.9767 times |
Fri 26 September 2025 |
30.26 (1.78%) |
29.58 |
28.30 - 30.89 |
1.2823 times |

Monthly price and charts EasternTred Strong monthly Stock price targets for EasternTred 531346 are 30.49 and 35.48 | Monthly Target 1 | 26.67 | | Monthly Target 2 | 29.32 | | Monthly Target 3 | 31.656666666667 | | Monthly Target 4 | 34.31 | | Monthly Target 5 | 36.65 |
Monthly price and volumes Eastern Tred
| Date |
Closing |
Open |
Range |
Volume |
Fri 05 December 2025 |
31.98 (3.13%) |
31.00 |
29.00 - 33.99 |
0.0963 times |
Fri 28 November 2025 |
31.01 (0.68%) |
30.60 |
28.00 - 34.99 |
0.9318 times |
Fri 31 October 2025 |
30.80 (0.33%) |
30.70 |
27.01 - 35.89 |
1.7033 times |
Tue 30 September 2025 |
30.70 (2.27%) |
30.02 |
28.30 - 33.88 |
2.3111 times |
Fri 29 August 2025 |
30.02 (-13.71%) |
34.75 |
29.29 - 37.85 |
0.9279 times |
Thu 31 July 2025 |
34.79 (4.66%) |
33.08 |
32.31 - 36.00 |
0.6511 times |
Mon 30 June 2025 |
33.24 (-0.12%) |
33.12 |
31.00 - 36.97 |
0.7051 times |
Fri 30 May 2025 |
33.28 (-6.91%) |
35.70 |
32.00 - 38.30 |
0.662 times |
Wed 30 April 2025 |
35.75 (2.52%) |
34.17 |
31.00 - 39.00 |
0.2433 times |
Fri 28 March 2025 |
34.87 (2.56%) |
38.50 |
30.00 - 40.50 |
1.7682 times |
Fri 28 February 2025 |
34.00 (-11.23%) |
40.39 |
33.99 - 40.39 |
0.4493 times |

DMA SMA EMA moving averages of Eastern Tred 531346
DMA (daily moving average) of Eastern Tred 531346
| DMA period | DMA value | | 5 day DMA | 31.93 | | 12 day DMA | 31.61 | | 20 day DMA | 31.63 | | 35 day DMA | 31.31 | | 50 day DMA | 30.93 | | 100 day DMA | 32.09 | | 150 day DMA | 33.06 | | 200 day DMA | 34.08 | EMA (exponential moving average) of Eastern Tred 531346
| EMA period | EMA current | EMA prev | EMA prev2 | | 5 day EMA | 31.69 | 31.54 | 32.01 | | 12 day EMA | 31.62 | 31.56 | 31.73 | | 20 day EMA | 31.52 | 31.47 | 31.56 | | 35 day EMA | 31.31 | 31.27 | 31.31 | | 50 day EMA | 31.08 | 31.04 | 31.06 |
SMA (simple moving average) of Eastern Tred 531346
| SMA period | SMA current | SMA prev | SMA prev2 | | 5 day SMA | 31.93 | 31.74 | 31.91 | | 12 day SMA | 31.61 | 31.6 | 31.71 | | 20 day SMA | 31.63 | 31.48 | 31.47 | | 35 day SMA | 31.31 | 31.25 | 31.23 | | 50 day SMA | 30.93 | 30.93 | 30.95 | | 100 day SMA | 32.09 | 32.1 | 32.12 | | 150 day SMA | 33.06 | 33.08 | 33.14 | | 200 day SMA | 34.08 | 34.12 | 34.17 |
|
|
