AmitIntnl 531300 full analysis,charts,indicators,moving averages,SMA,DMA,EMA,ADX,MACD,RSIAmit Intnl 531300 WideScreen charts, DMA,SMA,EMA technical analysis, forecast prediction, by indicators ADX,MACD,RSI,CCI BSE stock exchange
Daily price and charts and targets AmitIntnl Strong Daily Stock price targets for AmitIntnl 531300 are 3.84 and 4.14 | Daily Target 1 | 3.59 | | Daily Target 2 | 3.78 | | Daily Target 3 | 3.8866666666667 | | Daily Target 4 | 4.08 | | Daily Target 5 | 4.19 |
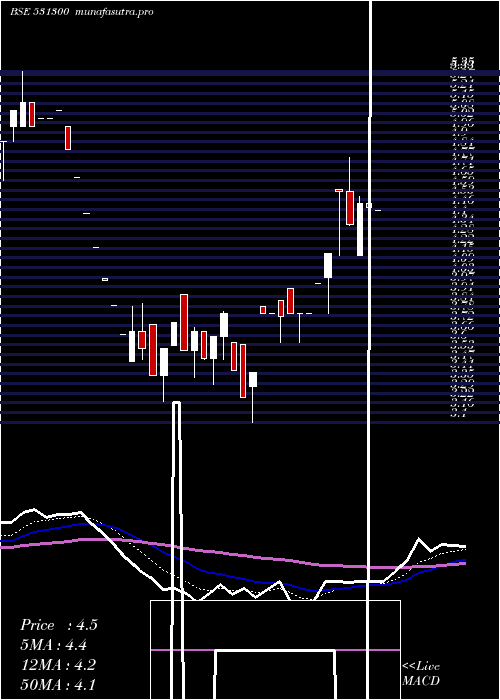
Daily price and volume Amit Intnl
| Date |
Closing |
Open |
Range |
Volume |
Fri 05 December 2025 |
3.98 (3.65%) |
3.90 |
3.69 - 3.99 |
2.1296 times |
Thu 04 December 2025 |
3.84 (-2.54%) |
3.90 |
3.75 - 4.00 |
2.6663 times |
Wed 03 December 2025 |
3.94 (3.68%) |
3.80 |
3.70 - 3.98 |
0.0837 times |
Tue 02 December 2025 |
3.80 (-5%) |
3.92 |
3.80 - 4.19 |
0.7937 times |
Mon 01 December 2025 |
4.00 (3.63%) |
4.05 |
3.68 - 4.05 |
0.8601 times |
Fri 28 November 2025 |
3.86 (-4.69%) |
4.00 |
3.85 - 4.03 |
0.8882 times |
Thu 27 November 2025 |
4.05 (1.25%) |
3.82 |
3.82 - 4.19 |
1.0946 times |
Wed 26 November 2025 |
4.00 (0%) |
4.00 |
3.86 - 4.10 |
0.805 times |
Tue 25 November 2025 |
4.00 (-4.53%) |
4.19 |
3.99 - 4.39 |
0.6255 times |
Mon 24 November 2025 |
4.19 (-4.56%) |
4.60 |
4.19 - 4.60 |
0.0531 times |
Fri 21 November 2025 |
4.39 (0.92%) |
4.26 |
4.25 - 4.55 |
1.495 times |
Weekly price and charts AmitIntnl Strong weekly Stock price targets for AmitIntnl 531300 are 3.58 and 4.09 | Weekly Target 1 | 3.44 | | Weekly Target 2 | 3.71 | | Weekly Target 3 | 3.95 | | Weekly Target 4 | 4.22 | | Weekly Target 5 | 4.46 |
Weekly price and volumes for Amit Intnl
| Date |
Closing |
Open |
Range |
Volume |
Fri 05 December 2025 |
3.98 (3.11%) |
4.05 |
3.68 - 4.19 |
3.6103 times |
Fri 28 November 2025 |
3.86 (-12.07%) |
4.60 |
3.82 - 4.60 |
1.9155 times |
Fri 21 November 2025 |
4.39 (3.54%) |
4.03 |
4.03 - 4.55 |
2.5593 times |
Fri 14 November 2025 |
4.24 (6%) |
3.90 |
3.71 - 4.60 |
1.653 times |
Fri 07 November 2025 |
4.00 (-3.61%) |
4.23 |
4.00 - 4.23 |
0.0203 times |
Fri 31 October 2025 |
4.15 (-1.19%) |
4.60 |
4.15 - 4.76 |
0.0266 times |
Thu 23 October 2025 |
4.20 (3.7%) |
4.25 |
3.85 - 4.48 |
0.0668 times |
Fri 17 October 2025 |
4.05 (-1.22%) |
4.30 |
3.67 - 4.38 |
0.058 times |
Fri 10 October 2025 |
4.10 (0.74%) |
4.27 |
3.87 - 4.46 |
0.0679 times |
Fri 03 October 2025 |
4.07 (9.12%) |
3.70 |
3.55 - 4.07 |
0.0221 times |
Fri 26 September 2025 |
3.73 (-4.36%) |
3.85 |
3.66 - 4.16 |
0.0436 times |

Monthly price and charts AmitIntnl Strong monthly Stock price targets for AmitIntnl 531300 are 3.58 and 4.09 | Monthly Target 1 | 3.44 | | Monthly Target 2 | 3.71 | | Monthly Target 3 | 3.95 | | Monthly Target 4 | 4.22 | | Monthly Target 5 | 4.46 |
Monthly price and volumes Amit Intnl
| Date |
Closing |
Open |
Range |
Volume |
Fri 05 December 2025 |
3.98 (3.11%) |
4.05 |
3.68 - 4.19 |
3.132 times |
Fri 28 November 2025 |
3.86 (-6.99%) |
4.23 |
3.71 - 4.60 |
5.3336 times |
Fri 31 October 2025 |
4.15 (8.36%) |
4.00 |
3.67 - 4.76 |
0.2062 times |
Tue 30 September 2025 |
3.83 (-14.7%) |
4.71 |
3.47 - 4.73 |
0.2499 times |
Fri 29 August 2025 |
4.49 (42.54%) |
3.15 |
3.00 - 4.49 |
0.1588 times |
Thu 31 July 2025 |
3.15 (-11.27%) |
3.55 |
3.00 - 4.05 |
0.0632 times |
Mon 30 June 2025 |
3.55 (-12.78%) |
4.27 |
3.53 - 5.06 |
0.4073 times |
Fri 30 May 2025 |
4.07 (-8.74%) |
4.46 |
3.71 - 4.50 |
0.0702 times |
Wed 30 April 2025 |
4.46 (30.03%) |
3.60 |
3.10 - 4.80 |
0.162 times |
Fri 28 March 2025 |
3.43 (-22.75%) |
4.22 |
3.23 - 4.22 |
0.2167 times |
Tue 18 February 2025 |
4.44 (-12.08%) |
5.05 |
4.44 - 5.10 |
0.005 times |

DMA SMA EMA moving averages of Amit Intnl 531300
DMA (daily moving average) of Amit Intnl 531300
| DMA period | DMA value | | 5 day DMA | 3.91 | | 12 day DMA | 4.03 | | 20 day DMA | 4.09 | | 35 day DMA | 4.14 | | 50 day DMA | 4.09 | | 100 day DMA | 3.9 | | 150 day DMA | 3.99 | | 200 day DMA | 4.07 | EMA (exponential moving average) of Amit Intnl 531300
| EMA period | EMA current | EMA prev | EMA prev2 | | 5 day EMA | 3.93 | 3.91 | 3.94 | | 12 day EMA | 4 | 4 | 4.03 | | 20 day EMA | 4.06 | 4.07 | 4.09 | | 35 day EMA | 4.06 | 4.06 | 4.07 | | 50 day EMA | 4.06 | 4.06 | 4.07 |
SMA (simple moving average) of Amit Intnl 531300
| SMA period | SMA current | SMA prev | SMA prev2 | | 5 day SMA | 3.91 | 3.89 | 3.93 | | 12 day SMA | 4.03 | 4.07 | 4.11 | | 20 day SMA | 4.09 | 4.1 | 4.12 | | 35 day SMA | 4.14 | 4.14 | 4.15 | | 50 day SMA | 4.09 | 4.09 | 4.09 | | 100 day SMA | 3.9 | 3.9 | 3.9 | | 150 day SMA | 3.99 | 3.99 | 3.99 | | 200 day SMA | 4.07 | 4.07 | 4.08 |
|
|
