CindrellaFi 531283 full analysis,charts,indicators,moving averages,SMA,DMA,EMA,ADX,MACD,RSICindrella Fi 531283 WideScreen charts, DMA,SMA,EMA technical analysis, forecast prediction, by indicators ADX,MACD,RSI,CCI BSE stock exchange
Daily price and charts and targets CindrellaFi Strong Daily Stock price targets for CindrellaFi 531283 are 12.86 and 12.87 | Daily Target 1 | 12.85 | | Daily Target 2 | 12.85 | | Daily Target 3 | 12.856666666667 | | Daily Target 4 | 12.86 | | Daily Target 5 | 12.87 |
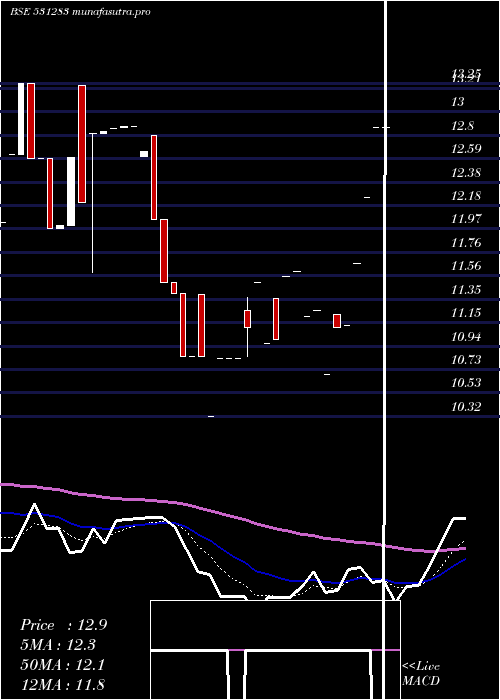
Daily price and volume Cindrella Fi
| Date |
Closing |
Open |
Range |
Volume |
Thu 23 October 2025 |
12.86 (0%) |
12.86 |
12.85 - 12.86 |
0.7285 times |
Tue 21 October 2025 |
12.86 (4.98%) |
12.86 |
12.86 - 12.86 |
0.0006 times |
Mon 20 October 2025 |
12.25 (4.97%) |
12.25 |
12.25 - 12.25 |
0.0955 times |
Fri 17 October 2025 |
11.67 (4.95%) |
11.67 |
11.67 - 11.67 |
3.9054 times |
Thu 16 October 2025 |
11.12 (0.18%) |
11.12 |
11.12 - 11.12 |
0.0063 times |
Wed 15 October 2025 |
11.10 (3.84%) |
11.22 |
11.10 - 11.22 |
3.4836 times |
Tue 14 October 2025 |
10.69 (-4.98%) |
10.69 |
10.69 - 10.69 |
0.0006 times |
Tue 07 October 2025 |
11.25 (0.45%) |
11.25 |
11.25 - 11.25 |
0.5691 times |
Mon 06 October 2025 |
11.20 (-3.45%) |
11.20 |
11.20 - 11.20 |
0.0721 times |
Fri 03 October 2025 |
11.60 (0.43%) |
11.60 |
11.60 - 11.60 |
1.1382 times |
Wed 01 October 2025 |
11.55 (5%) |
11.55 |
11.55 - 11.55 |
0.9334 times |
Weekly price and charts CindrellaFi Strong weekly Stock price targets for CindrellaFi 531283 are 12.56 and 13.17 | Weekly Target 1 | 12.05 | | Weekly Target 2 | 12.45 | | Weekly Target 3 | 12.656666666667 | | Weekly Target 4 | 13.06 | | Weekly Target 5 | 13.27 |
Weekly price and volumes for Cindrella Fi
| Date |
Closing |
Open |
Range |
Volume |
Thu 23 October 2025 |
12.86 (10.2%) |
12.25 |
12.25 - 12.86 |
0.5812 times |
Fri 17 October 2025 |
11.67 (3.73%) |
10.69 |
10.69 - 11.67 |
5.2126 times |
Tue 07 October 2025 |
11.25 (-3.02%) |
11.20 |
11.20 - 11.25 |
0.4519 times |
Fri 03 October 2025 |
11.60 (5.84%) |
11.36 |
11.00 - 11.60 |
1.4698 times |
Fri 26 September 2025 |
10.96 (1.2%) |
10.83 |
10.83 - 11.50 |
0.4109 times |
Thu 18 September 2025 |
10.83 (4.94%) |
10.83 |
10.83 - 10.83 |
0.0227 times |
Fri 12 September 2025 |
10.32 (-4.88%) |
10.85 |
10.32 - 11.39 |
0.1194 times |
Thu 04 September 2025 |
10.85 (-5.65%) |
11.50 |
10.85 - 11.50 |
0.1457 times |
Thu 28 August 2025 |
11.50 (-10.64%) |
12.61 |
11.50 - 12.79 |
1.1182 times |
Thu 21 August 2025 |
12.87 (0.16%) |
12.86 |
12.86 - 12.87 |
0.4675 times |
Thu 14 August 2025 |
12.85 (5.33%) |
12.81 |
11.59 - 12.85 |
2.3687 times |

Monthly price and charts CindrellaFi Strong monthly Stock price targets for CindrellaFi 531283 are 11.78 and 13.95 | Monthly Target 1 | 9.97 | | Monthly Target 2 | 11.41 | | Monthly Target 3 | 12.136666666667 | | Monthly Target 4 | 13.58 | | Monthly Target 5 | 14.31 |
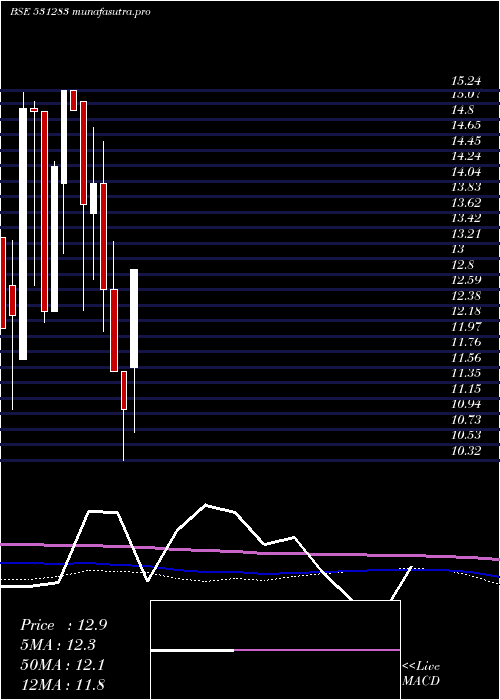
Monthly price and volumes Cindrella Fi
| Date |
Closing |
Open |
Range |
Volume |
Thu 23 October 2025 |
12.86 (16.91%) |
11.55 |
10.69 - 12.86 |
2.8065 times |
Mon 29 September 2025 |
11.00 (-4.35%) |
11.50 |
10.32 - 11.50 |
0.2581 times |
Thu 28 August 2025 |
11.50 (-8.66%) |
12.59 |
11.50 - 13.23 |
3.2494 times |
Thu 31 July 2025 |
12.59 (-10.07%) |
14.00 |
12.03 - 14.56 |
0.5222 times |
Mon 30 June 2025 |
14.00 (1.97%) |
13.60 |
12.73 - 14.75 |
0.5382 times |
Fri 30 May 2025 |
13.73 (-8.34%) |
15.10 |
12.32 - 15.10 |
1.0495 times |
Tue 29 April 2025 |
14.98 (-1.71%) |
15.24 |
14.98 - 15.24 |
0.3177 times |
Fri 28 March 2025 |
15.24 (7.1%) |
14.00 |
13.07 - 15.24 |
0.2211 times |
Fri 28 February 2025 |
14.23 (15.69%) |
12.30 |
12.30 - 14.30 |
0.3936 times |
Thu 30 January 2025 |
12.30 (-17.78%) |
14.96 |
12.16 - 14.96 |
0.6437 times |
Tue 31 December 2024 |
14.96 (-0.27%) |
15.00 |
12.65 - 15.10 |
1.8152 times |
DMA SMA EMA moving averages of Cindrella Fi 531283
DMA (daily moving average) of Cindrella Fi 531283
| DMA period | DMA value | | 5 day DMA | 12.15 | | 12 day DMA | 11.6 | | 20 day DMA | 11.32 | | 35 day DMA | 11.68 | | 50 day DMA | 12.08 | | 100 day DMA | 13.17 | | 150 day DMA | 13.4 | | 200 day DMA | 13.39 | EMA (exponential moving average) of Cindrella Fi 531283
| EMA period | EMA current | EMA prev | EMA prev2 | | 5 day EMA | 12.31 | 12.03 | 11.61 | | 12 day EMA | 11.81 | 11.62 | 11.4 | | 20 day EMA | 11.7 | 11.58 | 11.45 | | 35 day EMA | 11.92 | 11.86 | 11.8 | | 50 day EMA | 12.27 | 12.25 | 12.23 |
SMA (simple moving average) of Cindrella Fi 531283
| SMA period | SMA current | SMA prev | SMA prev2 | | 5 day SMA | 12.15 | 11.8 | 11.37 | | 12 day SMA | 11.6 | 11.44 | 11.32 | | 20 day SMA | 11.32 | 11.22 | 11.12 | | 35 day SMA | 11.68 | 11.67 | 11.66 | | 50 day SMA | 12.08 | 12.12 | 12.15 | | 100 day SMA | 13.17 | 13.19 | 13.21 | | 150 day SMA | 13.4 | 13.42 | 13.43 | | 200 day SMA | 13.39 | 13.39 | 13.4 |
|
|
