SuryaIndustrial 531262 full analysis,charts,indicators,moving averages,SMA,DMA,EMA,ADX,MACD,RSISurya Industrial 531262 WideScreen charts, DMA,SMA,EMA technical analysis, forecast prediction, by indicators ADX,MACD,RSI,CCI BSE stock exchange
Daily price and charts and targets SuryaIndustrial Strong Daily Stock price targets for SuryaIndustrial 531262 are 28.51 and 28.94 | Daily Target 1 | 28.43 | | Daily Target 2 | 28.58 | | Daily Target 3 | 28.863333333333 | | Daily Target 4 | 29.01 | | Daily Target 5 | 29.29 |
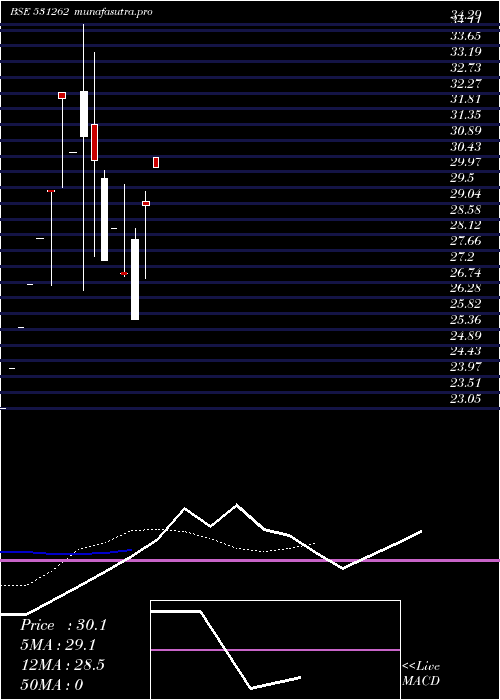
Daily price and volume Surya Industrial
| Date |
Closing |
Open |
Range |
Volume |
Tue 21 October 2025 |
28.72 (-1.48%) |
29.15 |
28.72 - 29.15 |
1.3586 times |
Mon 20 October 2025 |
29.15 (3.11%) |
28.27 |
28.27 - 29.27 |
0.7203 times |
Fri 17 October 2025 |
28.27 (-0.39%) |
28.27 |
28.27 - 28.27 |
0.0026 times |
Thu 16 October 2025 |
28.38 (0.82%) |
27.00 |
27.00 - 28.40 |
0.2487 times |
Wed 15 October 2025 |
28.15 (1.44%) |
28.25 |
28.15 - 28.25 |
3.0633 times |
Mon 13 October 2025 |
27.75 (2.97%) |
28.25 |
27.75 - 28.25 |
1.0151 times |
Fri 10 October 2025 |
26.95 (0.6%) |
27.33 |
26.95 - 27.33 |
0.059 times |
Thu 09 October 2025 |
26.79 (3.08%) |
27.28 |
26.79 - 27.28 |
0.423 times |
Wed 08 October 2025 |
25.99 (0.04%) |
25.86 |
25.86 - 26.00 |
3.0556 times |
Tue 07 October 2025 |
25.98 (4.76%) |
25.99 |
25.98 - 25.99 |
0.0538 times |
Mon 06 October 2025 |
24.80 (4.86%) |
22.50 |
22.50 - 24.82 |
9.9257 times |
Weekly price and charts SuryaIndustrial Strong weekly Stock price targets for SuryaIndustrial 531262 are 28.5 and 29.5 | Weekly Target 1 | 27.75 | | Weekly Target 2 | 28.24 | | Weekly Target 3 | 28.753333333333 | | Weekly Target 4 | 29.24 | | Weekly Target 5 | 29.75 |
Weekly price and volumes for Surya Industrial
| Date |
Closing |
Open |
Range |
Volume |
Tue 21 October 2025 |
28.72 (1.59%) |
28.27 |
28.27 - 29.27 |
0.2112 times |
Fri 17 October 2025 |
28.27 (4.9%) |
28.25 |
27.00 - 28.40 |
0.4399 times |
Fri 10 October 2025 |
26.95 (13.95%) |
22.50 |
22.50 - 27.33 |
1.3734 times |
Fri 03 October 2025 |
23.65 (-5.4%) |
25.00 |
23.62 - 26.24 |
1.0215 times |
Fri 26 September 2025 |
25.00 (-3.1%) |
27.00 |
25.00 - 27.65 |
1.5706 times |
Fri 19 September 2025 |
25.80 (-4.34%) |
26.97 |
25.27 - 27.80 |
1.1119 times |
Fri 12 September 2025 |
26.97 (17.26%) |
23.50 |
21.86 - 27.05 |
1.5583 times |
Fri 05 September 2025 |
23.00 (4.55%) |
23.00 |
21.00 - 24.12 |
1.3445 times |
Thu 28 August 2025 |
22.00 (4.12%) |
22.10 |
20.10 - 23.27 |
1.2833 times |
Fri 22 August 2025 |
21.13 (-4.99%) |
22.13 |
21.13 - 22.13 |
0.0854 times |
Thu 07 August 2025 |
22.24 (-2.71%) |
22.86 |
20.86 - 24.17 |
2.3506 times |

Monthly price and charts SuryaIndustrial Strong monthly Stock price targets for SuryaIndustrial 531262 are 25.61 and 32.38 | Monthly Target 1 | 20.06 | | Monthly Target 2 | 24.39 | | Monthly Target 3 | 26.83 | | Monthly Target 4 | 31.16 | | Monthly Target 5 | 33.6 |
Monthly price and volumes Surya Industrial
| Date |
Closing |
Open |
Range |
Volume |
Tue 21 October 2025 |
28.72 (14.88%) |
25.00 |
22.50 - 29.27 |
0.4993 times |
Mon 29 September 2025 |
25.00 (13.64%) |
23.00 |
21.00 - 27.80 |
0.916 times |
Thu 28 August 2025 |
22.00 (1.01%) |
21.10 |
20.10 - 24.17 |
0.6192 times |
Thu 31 July 2025 |
21.78 (-24.64%) |
30.30 |
21.65 - 32.00 |
0.3748 times |
Thu 26 June 2025 |
28.90 (-4.4%) |
29.74 |
28.36 - 32.94 |
0.2346 times |
Fri 30 May 2025 |
30.23 (23.39%) |
25.00 |
24.56 - 31.20 |
0.5786 times |
Wed 30 April 2025 |
24.50 (-23.72%) |
30.52 |
24.00 - 34.29 |
2.1963 times |
Fri 28 March 2025 |
32.12 (0%) |
23.05 |
23.05 - 32.30 |
2.5811 times |
Wed 22 October 2025 |
(0%) |
|
- |
0 times |

DMA SMA EMA moving averages of Surya Industrial 531262
DMA (daily moving average) of Surya Industrial 531262
| DMA period | DMA value | | 5 day DMA | 28.53 | | 12 day DMA | 27.05 | | 20 day DMA | 26.5 | | 35 day DMA | 25.58 | | 50 day DMA | 24.9 | | 100 day DMA | 26.91 | | 150 day DMA | | | 200 day DMA | | EMA (exponential moving average) of Surya Industrial 531262
| EMA period | EMA current | EMA prev | EMA prev2 | | 5 day EMA | 28.41 | 28.26 | 27.82 | | 12 day EMA | 27.51 | 27.29 | 26.95 | | 20 day EMA | 26.87 | 26.68 | 26.42 | | 35 day EMA | 26.14 | 25.99 | 25.8 | | 50 day EMA | 25.6 | 25.47 | 25.32 |
SMA (simple moving average) of Surya Industrial 531262
| SMA period | SMA current | SMA prev | SMA prev2 | | 5 day SMA | 28.53 | 28.34 | 27.9 | | 12 day SMA | 27.05 | 26.73 | 26.38 | | 20 day SMA | 26.5 | 26.32 | 26.2 | | 35 day SMA | 25.58 | 25.39 | 25.19 | | 50 day SMA | 24.9 | 24.91 | 24.9 | | 100 day SMA | 26.91 | 26.89 | 26.85 | | 150 day SMA | | 200 day SMA |
|
|
