IndiaGelat 531253 full analysis,charts,indicators,moving averages,SMA,DMA,EMA,ADX,MACD,RSIIndia Gelat 531253 WideScreen charts, DMA,SMA,EMA technical analysis, forecast prediction, by indicators ADX,MACD,RSI,CCI BSE stock exchange
Daily price and charts and targets IndiaGelat Strong Daily Stock price targets for IndiaGelat 531253 are 333.1 and 343.55 | Daily Target 1 | 325.12 | | Daily Target 2 | 330.63 | | Daily Target 3 | 335.56666666667 | | Daily Target 4 | 341.08 | | Daily Target 5 | 346.02 |
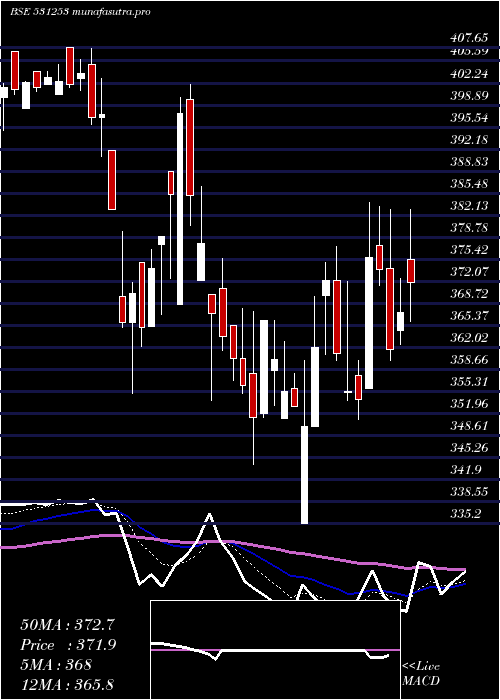
Daily price and volume India Gelat
| Date |
Closing |
Open |
Range |
Volume |
Fri 05 December 2025 |
336.15 (1.11%) |
333.00 |
330.05 - 340.50 |
0.4235 times |
Thu 04 December 2025 |
332.45 (0.09%) |
335.00 |
332.25 - 341.85 |
0.8476 times |
Wed 03 December 2025 |
332.15 (-0.46%) |
335.50 |
328.55 - 339.20 |
0.1808 times |
Tue 02 December 2025 |
333.70 (0.91%) |
331.65 |
325.30 - 337.60 |
0.8626 times |
Mon 01 December 2025 |
330.70 (-0.41%) |
330.85 |
327.75 - 336.85 |
0.6765 times |
Fri 28 November 2025 |
332.05 (-2.67%) |
333.50 |
328.70 - 337.70 |
3.2329 times |
Thu 27 November 2025 |
341.15 (-2.5%) |
349.90 |
338.25 - 349.90 |
1.273 times |
Wed 26 November 2025 |
349.90 (2.34%) |
332.35 |
332.35 - 352.00 |
0.3331 times |
Tue 25 November 2025 |
341.90 (-0.12%) |
349.20 |
332.00 - 349.20 |
0.8229 times |
Mon 24 November 2025 |
342.30 (-2.33%) |
344.65 |
341.20 - 347.90 |
1.3472 times |
Fri 21 November 2025 |
350.45 (-1.09%) |
351.00 |
350.45 - 354.30 |
0.4092 times |
Weekly price and charts IndiaGelat Strong weekly Stock price targets for IndiaGelat 531253 are 330.73 and 347.28 | Weekly Target 1 | 317.88 | | Weekly Target 2 | 327.02 | | Weekly Target 3 | 334.43333333333 | | Weekly Target 4 | 343.57 | | Weekly Target 5 | 350.98 |
Weekly price and volumes for India Gelat
| Date |
Closing |
Open |
Range |
Volume |
Fri 05 December 2025 |
336.15 (1.23%) |
330.85 |
325.30 - 341.85 |
0.7796 times |
Fri 28 November 2025 |
332.05 (-5.25%) |
344.65 |
328.70 - 352.00 |
1.8269 times |
Fri 21 November 2025 |
350.45 (-2.11%) |
364.95 |
350.35 - 364.95 |
0.4473 times |
Fri 14 November 2025 |
358.00 (11.56%) |
313.00 |
307.00 - 374.40 |
3.673 times |
Fri 07 November 2025 |
320.90 (-2.52%) |
321.00 |
312.00 - 332.55 |
0.6604 times |
Fri 31 October 2025 |
329.20 (1.01%) |
327.70 |
323.00 - 339.95 |
0.4049 times |
Thu 23 October 2025 |
325.90 (-0.35%) |
327.05 |
320.15 - 339.60 |
0.125 times |
Fri 17 October 2025 |
327.05 (-0.62%) |
329.10 |
325.50 - 341.95 |
0.3367 times |
Fri 10 October 2025 |
329.10 (-1.58%) |
338.75 |
320.00 - 340.00 |
0.9876 times |
Fri 03 October 2025 |
334.40 (-2.69%) |
354.85 |
330.15 - 354.85 |
0.7586 times |
Fri 26 September 2025 |
343.65 (-1.8%) |
349.95 |
340.00 - 359.75 |
0.5397 times |

Monthly price and charts IndiaGelat Strong monthly Stock price targets for IndiaGelat 531253 are 330.73 and 347.28 | Monthly Target 1 | 317.88 | | Monthly Target 2 | 327.02 | | Monthly Target 3 | 334.43333333333 | | Monthly Target 4 | 343.57 | | Monthly Target 5 | 350.98 |
Monthly price and volumes India Gelat
| Date |
Closing |
Open |
Range |
Volume |
Fri 05 December 2025 |
336.15 (1.23%) |
330.85 |
325.30 - 341.85 |
0.1647 times |
Fri 28 November 2025 |
332.05 (0.87%) |
321.00 |
307.00 - 374.40 |
1.3961 times |
Fri 31 October 2025 |
329.20 (-4.58%) |
347.05 |
320.00 - 347.05 |
0.482 times |
Tue 30 September 2025 |
345.00 (0%) |
354.25 |
330.20 - 359.80 |
0.8452 times |
Fri 29 August 2025 |
345.00 (-4.33%) |
358.80 |
341.00 - 375.00 |
0.6041 times |
Thu 31 July 2025 |
360.60 (-0.37%) |
362.00 |
350.00 - 377.00 |
0.707 times |
Mon 30 June 2025 |
361.95 (1.66%) |
356.60 |
355.00 - 400.00 |
1.0966 times |
Fri 30 May 2025 |
356.05 (-0.07%) |
358.10 |
335.20 - 384.65 |
0.8715 times |
Wed 30 April 2025 |
356.30 (-11.74%) |
405.00 |
354.00 - 407.50 |
0.46 times |
Fri 28 March 2025 |
403.70 (7.94%) |
374.00 |
365.70 - 407.65 |
3.3727 times |
Fri 28 February 2025 |
374.00 (-1.37%) |
379.20 |
357.50 - 386.00 |
1.4229 times |

DMA SMA EMA moving averages of India Gelat 531253
DMA (daily moving average) of India Gelat 531253
| DMA period | DMA value | | 5 day DMA | 333.03 | | 12 day DMA | 339.77 | | 20 day DMA | 344.08 | | 35 day DMA | 336.78 | | 50 day DMA | 336.87 | | 100 day DMA | 345.64 | | 150 day DMA | 352.55 | | 200 day DMA | 360.14 | EMA (exponential moving average) of India Gelat 531253
| EMA period | EMA current | EMA prev | EMA prev2 | | 5 day EMA | 334.78 | 334.1 | 334.92 | | 12 day EMA | 337.83 | 338.13 | 339.16 | | 20 day EMA | 338.93 | 339.22 | 339.93 | | 35 day EMA | 339.8 | 340.01 | 340.45 | | 50 day EMA | 337.78 | 337.85 | 338.07 |
SMA (simple moving average) of India Gelat 531253
| SMA period | SMA current | SMA prev | SMA prev2 | | 5 day SMA | 333.03 | 332.21 | 333.95 | | 12 day SMA | 339.77 | 341.18 | 343.11 | | 20 day SMA | 344.08 | 343.29 | 342.59 | | 35 day SMA | 336.78 | 336.66 | 336.57 | | 50 day SMA | 336.87 | 337.14 | 337.5 | | 100 day SMA | 345.64 | 345.93 | 346.27 | | 150 day SMA | 352.55 | 352.74 | 352.97 | | 200 day SMA | 360.14 | 360.36 | 360.59 |
|
|
