ManapFin 531213 full analysis,charts,indicators,moving averages,SMA,DMA,EMA,ADX,MACD,RSIManap Fin 531213 WideScreen charts, DMA,SMA,EMA technical analysis, forecast prediction, by indicators ADX,MACD,RSI,CCI BSE stock exchange
Daily price and charts and targets ManapFin Strong Daily Stock price targets for ManapFin 531213 are 279.98 and 285.68 | Daily Target 1 | 275.48 | | Daily Target 2 | 278.77 | | Daily Target 3 | 281.18333333333 | | Daily Target 4 | 284.47 | | Daily Target 5 | 286.88 |
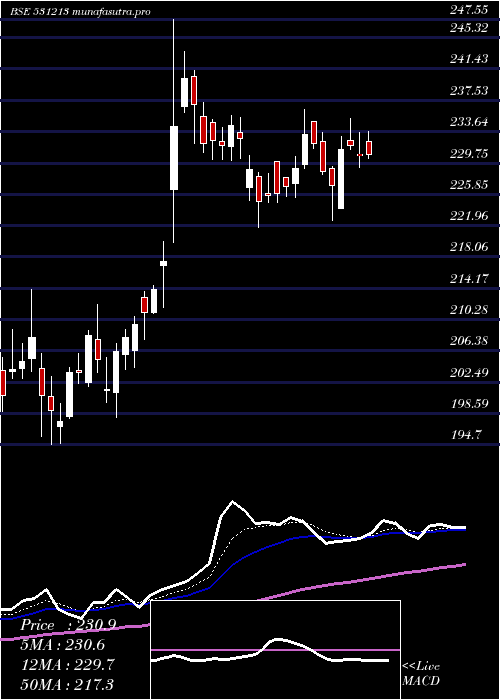
Daily price and volume Manap Fin
| Date |
Closing |
Open |
Range |
Volume |
Thu 23 October 2025 |
282.05 (-1.43%) |
281.90 |
277.90 - 283.60 |
1.7653 times |
Tue 21 October 2025 |
286.15 (-0.56%) |
289.95 |
285.00 - 289.95 |
0.233 times |
Mon 20 October 2025 |
287.75 (1.28%) |
284.40 |
283.30 - 288.25 |
0.6881 times |
Fri 17 October 2025 |
284.10 (-0.96%) |
285.20 |
283.10 - 291.35 |
1.1019 times |
Thu 16 October 2025 |
286.85 (-0.81%) |
290.05 |
286.10 - 290.50 |
0.5472 times |
Wed 15 October 2025 |
289.20 (1.88%) |
283.30 |
283.30 - 289.90 |
1.1754 times |
Tue 14 October 2025 |
283.85 (-0.94%) |
288.15 |
282.95 - 292.00 |
1.3437 times |
Mon 13 October 2025 |
286.55 (0.61%) |
284.60 |
283.25 - 287.20 |
1.0814 times |
Fri 10 October 2025 |
284.80 (-3.11%) |
288.95 |
282.90 - 294.75 |
1.6486 times |
Thu 09 October 2025 |
293.95 (0.38%) |
292.55 |
290.75 - 295.35 |
0.4156 times |
Wed 08 October 2025 |
292.85 (0.64%) |
291.55 |
288.85 - 295.50 |
0.8315 times |
Weekly price and charts ManapFin Strong weekly Stock price targets for ManapFin 531213 are 273.95 and 286 | Weekly Target 1 | 271.25 | | Weekly Target 2 | 276.65 | | Weekly Target 3 | 283.3 | | Weekly Target 4 | 288.7 | | Weekly Target 5 | 295.35 |
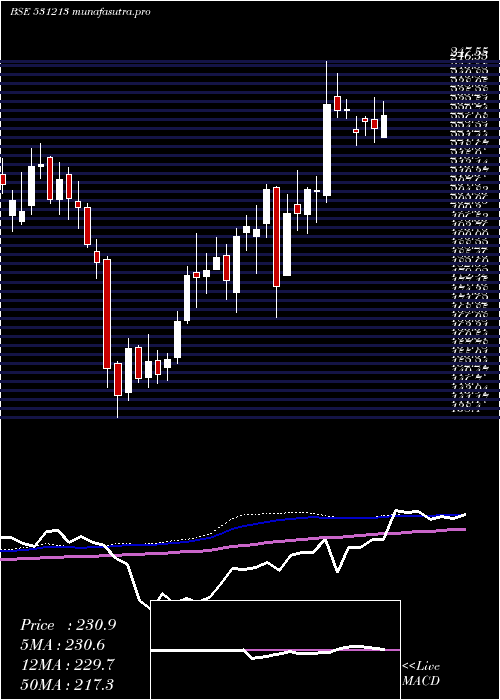
Weekly price and volumes for Manap Fin
| Date |
Closing |
Open |
Range |
Volume |
Thu 23 October 2025 |
282.05 (-0.72%) |
284.40 |
277.90 - 289.95 |
0.6708 times |
Fri 17 October 2025 |
284.10 (-0.25%) |
284.60 |
282.95 - 292.00 |
1.3109 times |
Fri 10 October 2025 |
284.80 (-0.37%) |
285.30 |
282.90 - 295.50 |
1.2015 times |
Fri 03 October 2025 |
285.85 (3.19%) |
277.20 |
274.50 - 287.60 |
0.674 times |
Fri 26 September 2025 |
277.00 (-3.28%) |
286.20 |
275.30 - 296.95 |
0.8618 times |
Fri 19 September 2025 |
286.40 (-1.6%) |
291.05 |
285.60 - 298.00 |
0.6672 times |
Fri 12 September 2025 |
291.05 (2.34%) |
282.85 |
282.85 - 296.80 |
0.9764 times |
Fri 05 September 2025 |
284.40 (8.8%) |
260.00 |
260.00 - 292.55 |
1.9861 times |
Fri 29 August 2025 |
261.40 (-2.02%) |
266.50 |
259.55 - 274.50 |
0.8998 times |
Fri 22 August 2025 |
266.80 (0.24%) |
266.40 |
264.05 - 270.35 |
0.7516 times |
Thu 14 August 2025 |
266.15 (2.94%) |
251.15 |
250.70 - 267.75 |
3.7933 times |
Monthly price and charts ManapFin Strong monthly Stock price targets for ManapFin 531213 are 279.98 and 297.58 | Monthly Target 1 | 267.55 | | Monthly Target 2 | 274.8 | | Monthly Target 3 | 285.15 | | Monthly Target 4 | 292.4 | | Monthly Target 5 | 302.75 |
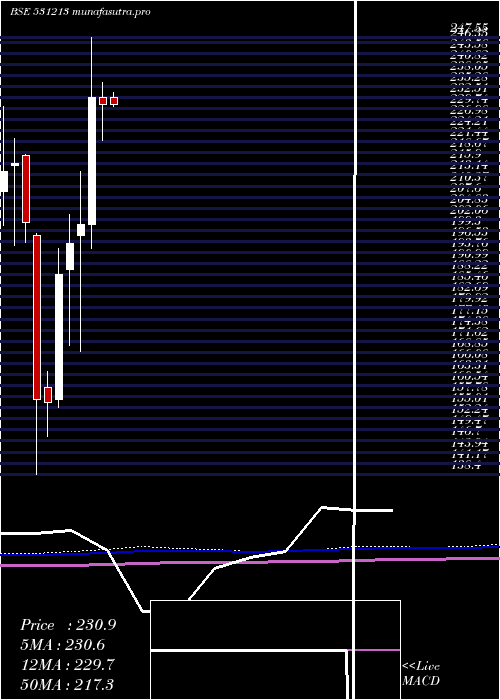
Monthly price and volumes Manap Fin
| Date |
Closing |
Open |
Range |
Volume |
Thu 23 October 2025 |
282.05 (0.53%) |
281.20 |
277.90 - 295.50 |
0.3206 times |
Tue 30 September 2025 |
280.55 (7.33%) |
260.00 |
260.00 - 298.00 |
0.4333 times |
Fri 29 August 2025 |
261.40 (3.55%) |
252.50 |
244.95 - 274.50 |
0.6293 times |
Thu 31 July 2025 |
252.45 (-8.35%) |
277.95 |
250.80 - 281.20 |
0.7658 times |
Mon 30 June 2025 |
275.45 (15.42%) |
238.00 |
231.65 - 285.00 |
1.1272 times |
Fri 30 May 2025 |
238.65 (3.47%) |
232.40 |
223.50 - 242.15 |
0.4415 times |
Wed 30 April 2025 |
230.65 (-0.82%) |
232.40 |
221.75 - 236.35 |
0.42 times |
Fri 28 March 2025 |
232.55 (15.78%) |
200.70 |
194.70 - 247.55 |
1.8795 times |
Fri 28 February 2025 |
200.85 (2.42%) |
197.95 |
169.10 - 213.95 |
2.2246 times |
Fri 31 January 2025 |
196.10 (4.17%) |
189.55 |
170.50 - 203.30 |
1.7582 times |
Tue 31 December 2024 |
188.25 (20.48%) |
156.95 |
155.00 - 194.80 |
1.7159 times |
DMA SMA EMA moving averages of Manap Fin 531213
DMA (daily moving average) of Manap Fin 531213
| DMA period | DMA value | | 5 day DMA | 285.38 | | 12 day DMA | 287.43 | | 20 day DMA | 285.99 | | 35 day DMA | 287.74 | | 50 day DMA | 281.08 | | 100 day DMA | 272.48 | | 150 day DMA | 257.21 | | 200 day DMA | 241.26 | EMA (exponential moving average) of Manap Fin 531213
| EMA period | EMA current | EMA prev | EMA prev2 | | 5 day EMA | 285.05 | 286.55 | 286.75 | | 12 day EMA | 286.16 | 286.91 | 287.05 | | 20 day EMA | 286.03 | 286.45 | 286.48 | | 35 day EMA | 282.71 | 282.75 | 282.55 | | 50 day EMA | 279.74 | 279.65 | 279.39 |
SMA (simple moving average) of Manap Fin 531213
| SMA period | SMA current | SMA prev | SMA prev2 | | 5 day SMA | 285.38 | 286.81 | 286.35 | | 12 day SMA | 287.43 | 288.16 | 288.13 | | 20 day SMA | 285.99 | 286.55 | 286.95 | | 35 day SMA | 287.74 | 287.72 | 287.4 | | 50 day SMA | 281.08 | 280.61 | 280.1 | | 100 day SMA | 272.48 | 271.98 | 271.43 | | 150 day SMA | 257.21 | 256.68 | 256.13 | | 200 day SMA | 241.26 | 240.78 | 240.27 |
|
|
