NalinLease 531212 full analysis,charts,indicators,moving averages,SMA,DMA,EMA,ADX,MACD,RSINalin Lease 531212 WideScreen charts, DMA,SMA,EMA technical analysis, forecast prediction, by indicators ADX,MACD,RSI,CCI BSE stock exchange
Daily price and charts and targets NalinLease Strong Daily Stock price targets for NalinLease 531212 are 48.5 and 51.5 | Daily Target 1 | 46 | | Daily Target 2 | 48 | | Daily Target 3 | 49 | | Daily Target 4 | 51 | | Daily Target 5 | 52 |
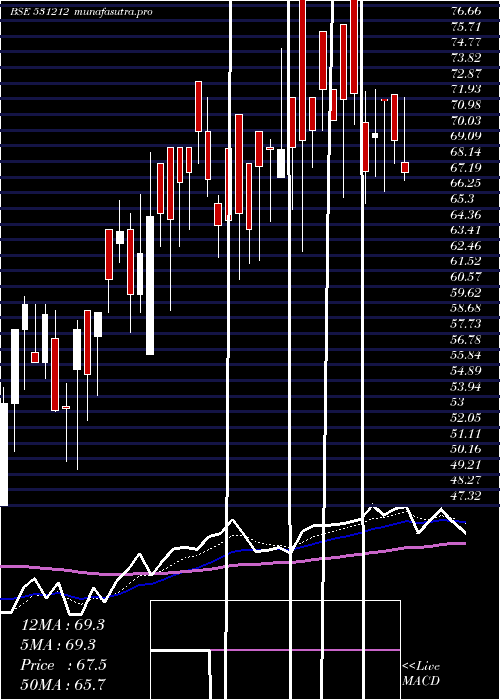
Daily price and volume Nalin Lease
| Date |
Closing |
Open |
Range |
Volume |
Thu 23 October 2025 |
50.00 (2.12%) |
48.95 |
47.00 - 50.00 |
0.8215 times |
Tue 21 October 2025 |
48.96 (2.17%) |
49.30 |
47.92 - 49.30 |
0.1465 times |
Mon 20 October 2025 |
47.92 (3.19%) |
45.11 |
45.00 - 47.97 |
1.5153 times |
Fri 17 October 2025 |
46.44 (0%) |
46.00 |
46.00 - 46.44 |
1.5987 times |
Thu 16 October 2025 |
46.44 (-0.49%) |
46.44 |
45.58 - 46.44 |
1.0074 times |
Wed 15 October 2025 |
46.67 (0.89%) |
46.10 |
46.00 - 48.10 |
0.8911 times |
Tue 14 October 2025 |
46.26 (-4.1%) |
49.35 |
46.01 - 49.35 |
2.6203 times |
Mon 13 October 2025 |
48.24 (-1.45%) |
50.30 |
46.79 - 50.30 |
1.0509 times |
Fri 10 October 2025 |
48.95 (1.45%) |
50.90 |
47.16 - 50.90 |
0.2411 times |
Thu 09 October 2025 |
48.25 (0.75%) |
50.95 |
48.00 - 51.45 |
0.1073 times |
Wed 08 October 2025 |
47.89 (-1.14%) |
46.94 |
46.79 - 50.97 |
2.0431 times |
Weekly price and charts NalinLease Strong weekly Stock price targets for NalinLease 531212 are 47.5 and 52.5 | Weekly Target 1 | 43.33 | | Weekly Target 2 | 46.67 | | Weekly Target 3 | 48.333333333333 | | Weekly Target 4 | 51.67 | | Weekly Target 5 | 53.33 |
Weekly price and volumes for Nalin Lease
| Date |
Closing |
Open |
Range |
Volume |
Thu 23 October 2025 |
50.00 (7.67%) |
45.11 |
45.00 - 50.00 |
0.7315 times |
Fri 17 October 2025 |
46.44 (-5.13%) |
50.30 |
45.58 - 50.30 |
2.1116 times |
Fri 10 October 2025 |
48.95 (-4.02%) |
49.73 |
46.79 - 51.45 |
1.1584 times |
Fri 03 October 2025 |
51.00 (-0.53%) |
49.56 |
47.11 - 53.96 |
1.1993 times |
Fri 26 September 2025 |
51.27 (-2.38%) |
51.17 |
49.52 - 59.99 |
0.5942 times |
Fri 19 September 2025 |
52.52 (1%) |
51.05 |
49.71 - 55.00 |
1.1292 times |
Fri 12 September 2025 |
52.00 (-3.13%) |
55.00 |
50.63 - 55.00 |
0.6424 times |
Fri 05 September 2025 |
53.68 (4.17%) |
51.78 |
49.90 - 54.00 |
0.8053 times |
Fri 29 August 2025 |
51.53 (-1.85%) |
53.45 |
46.00 - 56.49 |
1.1132 times |
Fri 22 August 2025 |
52.50 (2.18%) |
52.60 |
49.55 - 53.26 |
0.5149 times |
Thu 14 August 2025 |
51.38 (2.8%) |
48.61 |
48.61 - 54.75 |
1.5916 times |
Monthly price and charts NalinLease Strong monthly Stock price targets for NalinLease 531212 are 43.25 and 51.75 | Monthly Target 1 | 41 | | Monthly Target 2 | 45.5 | | Monthly Target 3 | 49.5 | | Monthly Target 4 | 54 | | Monthly Target 5 | 58 |
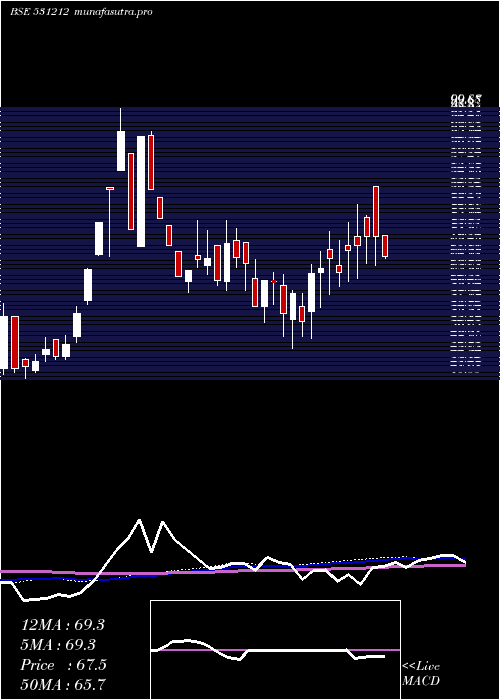
Monthly price and volumes Nalin Lease
| Date |
Closing |
Open |
Range |
Volume |
Thu 23 October 2025 |
50.00 (0.5%) |
50.50 |
45.00 - 53.50 |
0.7463 times |
Tue 30 September 2025 |
49.75 (-3.45%) |
51.78 |
49.21 - 59.99 |
0.653 times |
Fri 29 August 2025 |
51.53 (-2.76%) |
51.95 |
46.00 - 57.50 |
0.8302 times |
Thu 31 July 2025 |
52.99 (-11.51%) |
61.00 |
50.12 - 61.00 |
1.2064 times |
Mon 30 June 2025 |
59.88 (1.41%) |
59.05 |
53.13 - 62.90 |
1.3559 times |
Fri 30 May 2025 |
59.05 (-10.72%) |
70.90 |
54.66 - 70.90 |
1.5819 times |
Wed 30 April 2025 |
66.14 (3.34%) |
69.95 |
62.15 - 82.88 |
0.6996 times |
Fri 28 March 2025 |
64.00 (20.32%) |
55.55 |
49.51 - 72.98 |
0.6025 times |
Fri 28 February 2025 |
53.19 (-14.51%) |
62.00 |
47.32 - 64.00 |
0.9904 times |
Fri 31 January 2025 |
62.22 (-9.43%) |
68.70 |
53.00 - 75.45 |
1.3339 times |
Tue 31 December 2024 |
68.70 (8.67%) |
62.00 |
59.52 - 75.50 |
2.1734 times |

DMA SMA EMA moving averages of Nalin Lease 531212
DMA (daily moving average) of Nalin Lease 531212
| DMA period | DMA value | | 5 day DMA | 47.95 | | 12 day DMA | 47.87 | | 20 day DMA | 49.03 | | 35 day DMA | 50.38 | | 50 day DMA | 50.62 | | 100 day DMA | 53.1 | | 150 day DMA | 56.89 | | 200 day DMA | 57.87 | EMA (exponential moving average) of Nalin Lease 531212
| EMA period | EMA current | EMA prev | EMA prev2 | | 5 day EMA | 48.54 | 47.81 | 47.24 | | 12 day EMA | 48.45 | 48.17 | 48.03 | | 20 day EMA | 48.96 | 48.85 | 48.84 | | 35 day EMA | 49.65 | 49.63 | 49.67 | | 50 day EMA | 50.52 | 50.54 | 50.6 |
SMA (simple moving average) of Nalin Lease 531212
| SMA period | SMA current | SMA prev | SMA prev2 | | 5 day SMA | 47.95 | 47.29 | 46.75 | | 12 day SMA | 47.87 | 47.9 | 48.07 | | 20 day SMA | 49.03 | 49.12 | 49.33 | | 35 day SMA | 50.38 | 50.42 | 50.55 | | 50 day SMA | 50.62 | 50.62 | 50.7 | | 100 day SMA | 53.1 | 53.19 | 53.31 | | 150 day SMA | 56.89 | 56.96 | 57.03 | | 200 day SMA | 57.87 | 57.96 | 58.04 |
|
|
