GlanceFin 531199 full analysis,charts,indicators,moving averages,SMA,DMA,EMA,ADX,MACD,RSIGlance Fin 531199 WideScreen charts, DMA,SMA,EMA technical analysis, forecast prediction, by indicators ADX,MACD,RSI,CCI BSE stock exchange
Daily price and charts and targets GlanceFin Strong Daily Stock price targets for GlanceFin 531199 are 216.53 and 217.48 | Daily Target 1 | 216.37 | | Daily Target 2 | 216.68 | | Daily Target 3 | 217.31666666667 | | Daily Target 4 | 217.63 | | Daily Target 5 | 218.27 |
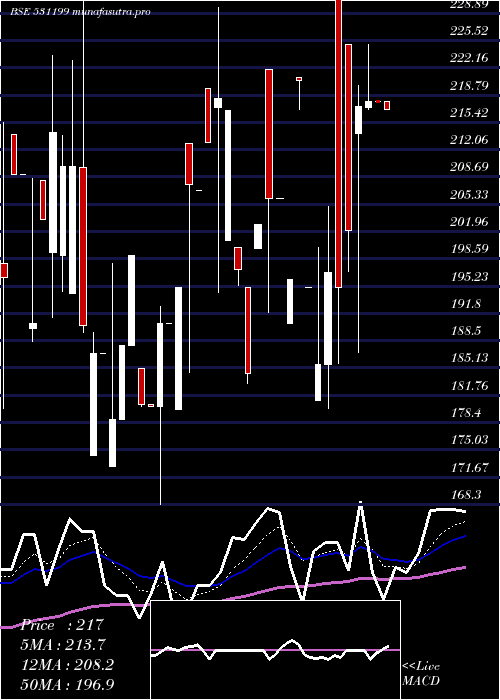
Daily price and volume Glance Fin
| Date |
Closing |
Open |
Range |
Volume |
Thu 23 October 2025 |
217.00 (-0.44%) |
217.95 |
217.00 - 217.95 |
0.2722 times |
Tue 21 October 2025 |
217.95 (-0.02%) |
218.00 |
217.95 - 218.00 |
0.0112 times |
Mon 20 October 2025 |
218.00 (0.28%) |
217.30 |
217.00 - 225.00 |
1.2118 times |
Fri 17 October 2025 |
217.40 (7.57%) |
214.00 |
187.00 - 220.00 |
0.8911 times |
Thu 16 October 2025 |
202.10 (3.64%) |
225.00 |
197.00 - 225.00 |
1.4691 times |
Wed 15 October 2025 |
195.00 (-0.94%) |
232.95 |
185.65 - 232.95 |
0.9471 times |
Tue 14 October 2025 |
196.85 (6.12%) |
185.50 |
180.10 - 205.05 |
4.258 times |
Mon 13 October 2025 |
185.50 (-4.87%) |
181.15 |
181.15 - 200.00 |
0.0336 times |
Fri 10 October 2025 |
195.00 (-11.62%) |
195.00 |
195.00 - 195.10 |
0.8613 times |
Thu 09 October 2025 |
220.65 (12.58%) |
221.00 |
217.00 - 221.00 |
0.0447 times |
Wed 08 October 2025 |
196.00 (-4.88%) |
190.60 |
190.60 - 196.00 |
0.6749 times |
Weekly price and charts GlanceFin Strong weekly Stock price targets for GlanceFin 531199 are 213 and 221 | Weekly Target 1 | 211.67 | | Weekly Target 2 | 214.33 | | Weekly Target 3 | 219.66666666667 | | Weekly Target 4 | 222.33 | | Weekly Target 5 | 227.67 |
Weekly price and volumes for Glance Fin
| Date |
Closing |
Open |
Range |
Volume |
Thu 23 October 2025 |
217.00 (-0.18%) |
217.30 |
217.00 - 225.00 |
0.2946 times |
Fri 17 October 2025 |
217.40 (11.49%) |
181.15 |
180.10 - 232.95 |
1.4973 times |
Fri 10 October 2025 |
195.00 (-5.36%) |
206.05 |
190.60 - 221.00 |
0.958 times |
Fri 03 October 2025 |
206.05 (-5%) |
200.00 |
183.20 - 222.00 |
2.1123 times |
Thu 25 September 2025 |
216.90 (1.85%) |
217.25 |
194.45 - 229.55 |
0.8905 times |
Thu 18 September 2025 |
212.95 (9.21%) |
212.80 |
184.50 - 219.55 |
1.465 times |
Fri 12 September 2025 |
195.00 (7.94%) |
180.65 |
168.30 - 195.00 |
0.2939 times |
Fri 05 September 2025 |
180.65 (-3.34%) |
186.90 |
173.00 - 199.00 |
0.7839 times |
Fri 29 August 2025 |
186.90 (-12.72%) |
199.00 |
174.35 - 230.40 |
1.0712 times |
Fri 22 August 2025 |
214.15 (12.36%) |
208.20 |
191.40 - 223.65 |
0.6333 times |
Thu 14 August 2025 |
190.60 (-2.93%) |
213.95 |
188.35 - 213.95 |
0.5767 times |

Monthly price and charts GlanceFin Strong monthly Stock price targets for GlanceFin 531199 are 198.55 and 251.4 | Monthly Target 1 | 157.17 | | Monthly Target 2 | 187.08 | | Monthly Target 3 | 210.01666666667 | | Monthly Target 4 | 239.93 | | Monthly Target 5 | 262.87 |
Monthly price and volumes Glance Fin
| Date |
Closing |
Open |
Range |
Volume |
Thu 23 October 2025 |
217.00 (17.68%) |
199.90 |
180.10 - 232.95 |
0.4287 times |
Tue 30 September 2025 |
184.40 (-1.34%) |
186.90 |
168.30 - 229.55 |
0.366 times |
Fri 29 August 2025 |
186.90 (-2.66%) |
183.00 |
174.35 - 230.40 |
0.497 times |
Wed 30 July 2025 |
192.00 (12.74%) |
178.00 |
161.10 - 203.55 |
6.2001 times |
Mon 30 June 2025 |
170.30 (10.55%) |
161.00 |
154.00 - 182.00 |
0.5808 times |
Thu 29 May 2025 |
154.05 (11.83%) |
131.00 |
124.55 - 154.05 |
0.8714 times |
Wed 30 April 2025 |
137.75 (3.57%) |
120.10 |
120.10 - 153.80 |
0.1731 times |
Wed 26 March 2025 |
133.00 (-10.07%) |
148.50 |
129.10 - 162.00 |
0.0637 times |
Fri 28 February 2025 |
147.90 (-5.8%) |
153.00 |
126.90 - 162.00 |
0.6067 times |
Fri 31 January 2025 |
157.00 (-19.84%) |
195.85 |
153.70 - 195.85 |
0.2126 times |
Tue 31 December 2024 |
195.85 (-1.8%) |
189.50 |
151.00 - 217.95 |
1.2305 times |

DMA SMA EMA moving averages of Glance Fin 531199
DMA (daily moving average) of Glance Fin 531199
| DMA period | DMA value | | 5 day DMA | 214.49 | | 12 day DMA | 205.63 | | 20 day DMA | 205.67 | | 35 day DMA | 200.63 | | 50 day DMA | 199.64 | | 100 day DMA | 179.51 | | 150 day DMA | 167.53 | | 200 day DMA | 169.86 | EMA (exponential moving average) of Glance Fin 531199
| EMA period | EMA current | EMA prev | EMA prev2 | | 5 day EMA | 213.72 | 212.08 | 209.14 | | 12 day EMA | 208.22 | 206.63 | 204.57 | | 20 day EMA | 205.28 | 204.05 | 202.59 | | 35 day EMA | 202.37 | 201.51 | 200.54 | | 50 day EMA | 199.84 | 199.14 | 198.37 |
SMA (simple moving average) of Glance Fin 531199
| SMA period | SMA current | SMA prev | SMA prev2 | | 5 day SMA | 214.49 | 210.09 | 205.87 | | 12 day SMA | 205.63 | 204.71 | 203.45 | | 20 day SMA | 205.67 | 205.21 | 204.06 | | 35 day SMA | 200.63 | 200.24 | 199.46 | | 50 day SMA | 199.64 | 199.18 | 198.54 | | 100 day SMA | 179.51 | 178.65 | 177.85 | | 150 day SMA | 167.53 | 167.13 | 166.73 | | 200 day SMA | 169.86 | 169.71 | 169.59 |
|
|
