ArmanFin 531179 full analysis,charts,indicators,moving averages,SMA,DMA,EMA,ADX,MACD,RSIArman Fin 531179 WideScreen charts, DMA,SMA,EMA technical analysis, forecast prediction, by indicators ADX,MACD,RSI,CCI BSE stock exchange
Daily price and charts and targets ArmanFin Strong Daily Stock price targets for ArmanFin 531179 are 1678.35 and 1712.4 | Daily Target 1 | 1650.53 | | Daily Target 2 | 1672.12 | | Daily Target 3 | 1684.5833333333 | | Daily Target 4 | 1706.17 | | Daily Target 5 | 1718.63 |
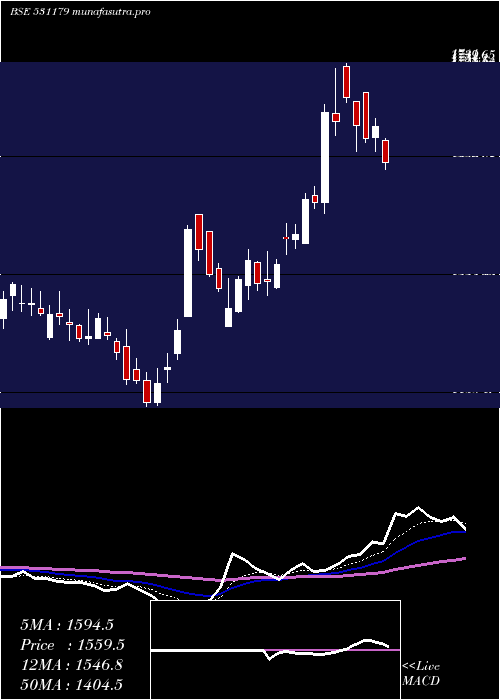
Daily price and volume Arman Fin
| Date |
Closing |
Open |
Range |
Volume |
Tue 21 October 2025 |
1693.70 (2.04%) |
1663.00 |
1663.00 - 1697.05 |
0.7322 times |
Mon 20 October 2025 |
1659.85 (1.58%) |
1635.30 |
1635.30 - 1667.70 |
0.7968 times |
Fri 17 October 2025 |
1634.00 (-1.13%) |
1629.95 |
1590.00 - 1656.00 |
0.8121 times |
Thu 16 October 2025 |
1652.65 (3.85%) |
1594.05 |
1590.10 - 1665.00 |
1.2391 times |
Wed 15 October 2025 |
1591.35 (-2.91%) |
1619.40 |
1587.25 - 1631.15 |
0.6701 times |
Tue 14 October 2025 |
1639.00 (-1.08%) |
1646.35 |
1590.30 - 1673.30 |
1.1659 times |
Mon 13 October 2025 |
1656.95 (1.63%) |
1592.10 |
1592.10 - 1664.45 |
0.6004 times |
Fri 10 October 2025 |
1630.40 (4.39%) |
1525.05 |
1525.05 - 1635.15 |
1.9721 times |
Thu 09 October 2025 |
1561.80 (0.6%) |
1560.00 |
1525.00 - 1570.00 |
1.6617 times |
Wed 08 October 2025 |
1552.55 (-0.36%) |
1542.60 |
1528.75 - 1560.00 |
0.3495 times |
Tue 07 October 2025 |
1558.10 (3.03%) |
1512.90 |
1512.35 - 1579.50 |
4.9103 times |
Weekly price and charts ArmanFin Strong weekly Stock price targets for ArmanFin 531179 are 1664.5 and 1726.25 | Weekly Target 1 | 1613.6 | | Weekly Target 2 | 1653.65 | | Weekly Target 3 | 1675.35 | | Weekly Target 4 | 1715.4 | | Weekly Target 5 | 1737.1 |
Weekly price and volumes for Arman Fin
| Date |
Closing |
Open |
Range |
Volume |
Tue 21 October 2025 |
1693.70 (3.65%) |
1635.30 |
1635.30 - 1697.05 |
0.188 times |
Fri 17 October 2025 |
1634.00 (0.22%) |
1592.10 |
1587.25 - 1673.30 |
0.5518 times |
Fri 10 October 2025 |
1630.40 (8.33%) |
1514.00 |
1495.50 - 1635.15 |
1.1663 times |
Fri 03 October 2025 |
1505.00 (1.95%) |
1476.90 |
1436.80 - 1531.00 |
0.5276 times |
Fri 26 September 2025 |
1476.20 (1.89%) |
1430.20 |
1430.20 - 1565.70 |
1.2358 times |
Fri 19 September 2025 |
1448.85 (1.29%) |
1440.00 |
1415.15 - 1485.00 |
1.2797 times |
Fri 12 September 2025 |
1430.35 (-1.3%) |
1451.00 |
1420.00 - 1484.50 |
0.6965 times |
Fri 05 September 2025 |
1449.15 (6.7%) |
1356.70 |
1352.35 - 1460.55 |
0.8127 times |
Fri 29 August 2025 |
1358.20 (-6.77%) |
1466.40 |
1353.25 - 1478.50 |
1.2609 times |
Fri 22 August 2025 |
1456.80 (6.1%) |
1370.60 |
1308.95 - 1537.75 |
2.2807 times |
Thu 14 August 2025 |
1373.05 (-7.51%) |
1492.90 |
1256.10 - 1500.00 |
3.9884 times |

Monthly price and charts ArmanFin Strong monthly Stock price targets for ArmanFin 531179 are 1574.95 and 1815.8 | Monthly Target 1 | 1374.8 | | Monthly Target 2 | 1534.25 | | Monthly Target 3 | 1615.65 | | Monthly Target 4 | 1775.1 | | Monthly Target 5 | 1856.5 |
Monthly price and volumes Arman Fin
| Date |
Closing |
Open |
Range |
Volume |
Tue 21 October 2025 |
1693.70 (17.33%) |
1459.50 |
1456.20 - 1697.05 |
0.2397 times |
Tue 30 September 2025 |
1443.55 (6.28%) |
1356.70 |
1352.35 - 1565.70 |
0.4751 times |
Fri 29 August 2025 |
1358.20 (-16.9%) |
1749.95 |
1256.10 - 1749.95 |
1.0231 times |
Thu 31 July 2025 |
1634.35 (-6.39%) |
1744.65 |
1589.95 - 1831.30 |
0.5717 times |
Mon 30 June 2025 |
1746.00 (9.24%) |
1476.05 |
1430.10 - 1849.95 |
1.4085 times |
Fri 30 May 2025 |
1598.25 (2.48%) |
1520.05 |
1403.40 - 1663.30 |
0.8924 times |
Wed 30 April 2025 |
1559.50 (20.74%) |
1285.30 |
1283.00 - 1741.00 |
1.4516 times |
Fri 28 March 2025 |
1291.60 (0.91%) |
1281.70 |
1111.60 - 1462.95 |
1.5043 times |
Fri 28 February 2025 |
1279.95 (-9.07%) |
1200.25 |
1200.25 - 1518.90 |
0.9878 times |
Fri 31 January 2025 |
1407.60 (13.52%) |
1256.20 |
1194.85 - 1475.00 |
1.4457 times |
Tue 31 December 2024 |
1240.00 (-6.58%) |
1329.00 |
1170.20 - 1423.00 |
1.3023 times |

DMA SMA EMA moving averages of Arman Fin 531179
DMA (daily moving average) of Arman Fin 531179
| DMA period | DMA value | | 5 day DMA | 1646.31 | | 12 day DMA | 1611.89 | | 20 day DMA | 1560.75 | | 35 day DMA | 1508.81 | | 50 day DMA | 1482.51 | | 100 day DMA | 1577.59 | | 150 day DMA | 1527.43 | | 200 day DMA | 1476.24 | EMA (exponential moving average) of Arman Fin 531179
| EMA period | EMA current | EMA prev | EMA prev2 | | 5 day EMA | 1655.82 | 1636.88 | 1625.39 | | 12 day EMA | 1613.91 | 1599.41 | 1588.43 | | 20 day EMA | 1578.93 | 1566.85 | 1557.06 | | 35 day EMA | 1542 | 1533.07 | 1525.61 | | 50 day EMA | 1507.65 | 1500.06 | 1493.54 |
SMA (simple moving average) of Arman Fin 531179
| SMA period | SMA current | SMA prev | SMA prev2 | | 5 day SMA | 1646.31 | 1635.37 | 1634.79 | | 12 day SMA | 1611.89 | 1596.17 | 1583.76 | | 20 day SMA | 1560.75 | 1548.52 | 1537.97 | | 35 day SMA | 1508.81 | 1500.6 | 1491.98 | | 50 day SMA | 1482.51 | 1479.25 | 1477.07 | | 100 day SMA | 1577.59 | 1575.91 | 1574.33 | | 150 day SMA | 1527.43 | 1524.37 | 1521.71 | | 200 day SMA | 1476.24 | 1473.8 | 1471.77 |
|
|
