EuroAsia 530929 full analysis,charts,indicators,moving averages,SMA,DMA,EMA,ADX,MACD,RSIEuro Asia 530929 WideScreen charts, DMA,SMA,EMA technical analysis, forecast prediction, by indicators ADX,MACD,RSI,CCI BSE stock exchange
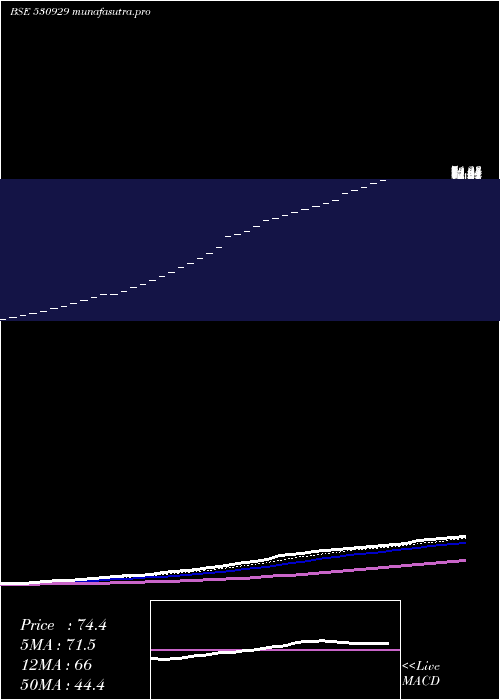
Daily price and charts and targets EuroAsia Strong Daily Stock price targets for EuroAsia 530929 are 791.95 and 791.95 | Daily Target 1 | 791.95 | | Daily Target 2 | 791.95 | | Daily Target 3 | 791.95 | | Daily Target 4 | 791.95 | | Daily Target 5 | 791.95 |
Daily price and volume Euro Asia
| Date |
Closing |
Open |
Range |
Volume |
Tue 21 October 2025 |
791.95 (2%) |
791.95 |
791.95 - 791.95 |
0.0582 times |
Mon 20 October 2025 |
776.45 (2%) |
776.45 |
776.45 - 776.45 |
0.2466 times |
Fri 17 October 2025 |
761.25 (2%) |
761.25 |
761.25 - 761.25 |
0.0562 times |
Thu 16 October 2025 |
746.35 (2%) |
746.35 |
746.35 - 746.35 |
1.0377 times |
Wed 15 October 2025 |
731.75 (1.99%) |
731.75 |
731.75 - 731.75 |
2.8157 times |
Tue 14 October 2025 |
717.45 (2%) |
717.45 |
717.45 - 717.45 |
0.1993 times |
Mon 13 October 2025 |
703.40 (1.99%) |
703.35 |
703.35 - 703.40 |
5.0348 times |
Fri 10 October 2025 |
689.65 (2%) |
689.65 |
689.65 - 689.65 |
0.3267 times |
Thu 09 October 2025 |
676.15 (2%) |
676.15 |
676.15 - 676.15 |
0.0447 times |
Wed 08 October 2025 |
662.90 (1.99%) |
662.90 |
662.90 - 662.90 |
0.1801 times |
Tue 07 October 2025 |
649.95 (1.99%) |
649.95 |
649.95 - 649.95 |
0.0275 times |
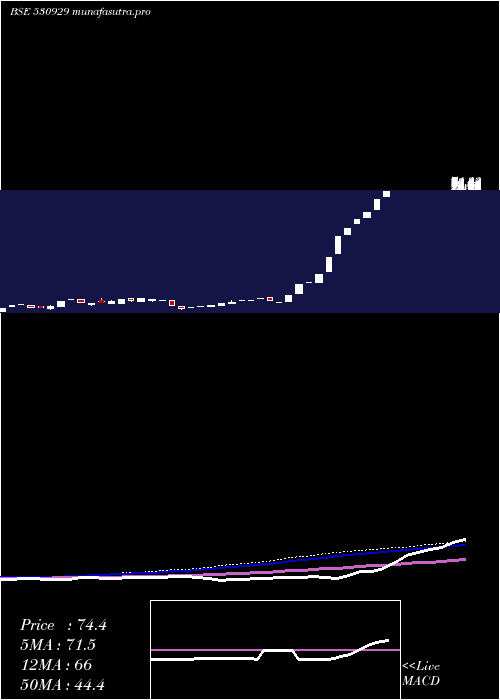
Weekly price and charts EuroAsia Strong weekly Stock price targets for EuroAsia 530929 are 784.2 and 799.7 | Weekly Target 1 | 771.28 | | Weekly Target 2 | 781.62 | | Weekly Target 3 | 786.78333333333 | | Weekly Target 4 | 797.12 | | Weekly Target 5 | 802.28 |
Weekly price and volumes for Euro Asia
| Date |
Closing |
Open |
Range |
Volume |
Tue 21 October 2025 |
791.95 (4.03%) |
776.45 |
776.45 - 791.95 |
0.2149 times |
Fri 17 October 2025 |
761.25 (10.38%) |
703.35 |
703.35 - 761.25 |
6.4454 times |
Fri 10 October 2025 |
689.65 (10.38%) |
637.25 |
637.25 - 689.65 |
0.5045 times |
Fri 03 October 2025 |
624.80 (8.23%) |
588.80 |
588.80 - 624.80 |
0.3768 times |
Fri 26 September 2025 |
577.30 (10.38%) |
533.45 |
533.45 - 577.30 |
1.2172 times |
Fri 19 September 2025 |
523.00 (10.4%) |
483.20 |
483.20 - 523.00 |
0.2756 times |
Fri 12 September 2025 |
473.75 (10.38%) |
437.75 |
437.75 - 473.75 |
0.0444 times |
Fri 05 September 2025 |
429.20 (10.38%) |
396.60 |
396.60 - 429.20 |
0.6729 times |
Fri 29 August 2025 |
388.85 (8.21%) |
366.50 |
366.50 - 388.85 |
0.1312 times |
Fri 22 August 2025 |
359.35 (10.37%) |
332.10 |
332.10 - 359.35 |
0.1172 times |
Thu 14 August 2025 |
325.60 (8.21%) |
306.90 |
306.90 - 325.60 |
0.2054 times |
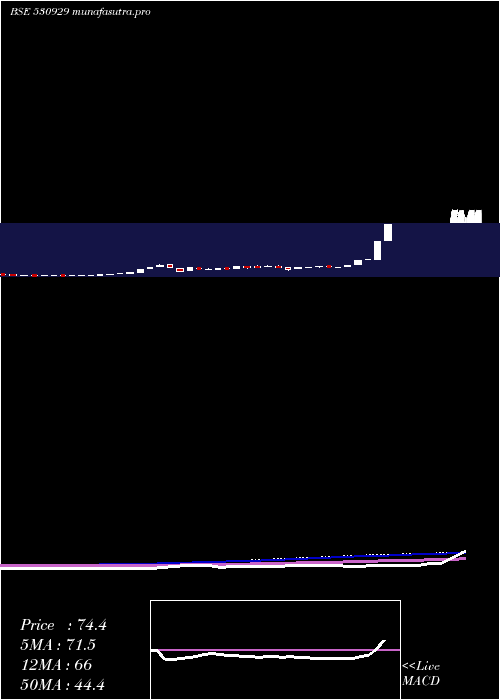
Monthly price and charts EuroAsia Strong monthly Stock price targets for EuroAsia 530929 are 702.25 and 881.65 | Monthly Target 1 | 552.75 | | Monthly Target 2 | 672.35 | | Monthly Target 3 | 732.15 | | Monthly Target 4 | 851.75 | | Monthly Target 5 | 911.55 |
Monthly price and volumes Euro Asia
| Date |
Closing |
Open |
Range |
Volume |
Tue 21 October 2025 |
791.95 (31.87%) |
612.55 |
612.55 - 791.95 |
6.0232 times |
Tue 30 September 2025 |
600.55 (54.44%) |
396.60 |
396.60 - 600.55 |
1.9405 times |
Fri 29 August 2025 |
388.85 (45.47%) |
272.60 |
272.60 - 388.85 |
0.4723 times |
Thu 31 July 2025 |
267.30 (57.28%) |
173.30 |
173.30 - 267.30 |
0.3728 times |
Mon 30 June 2025 |
169.95 (50.84%) |
114.90 |
114.90 - 169.95 |
0.0853 times |
Fri 30 May 2025 |
112.67 (51.38%) |
75.91 |
75.91 - 112.67 |
0.2894 times |
Wed 30 April 2025 |
74.43 (45.46%) |
52.19 |
52.19 - 74.43 |
0.2064 times |
Fri 28 March 2025 |
51.17 (88.26%) |
27.18 |
27.18 - 51.17 |
0.1101 times |
Mon 03 February 2025 |
27.18 (4.98%) |
27.18 |
27.18 - 27.18 |
0.0046 times |
Fri 31 January 2025 |
25.89 (33.8%) |
20.31 |
20.31 - 25.89 |
0.4954 times |
Thu 19 December 2024 |
19.35 (15.66%) |
17.56 |
17.56 - 19.35 |
0.0688 times |
DMA SMA EMA moving averages of Euro Asia 530929
DMA (daily moving average) of Euro Asia 530929
| DMA period | DMA value | | 5 day DMA | 761.55 | | 12 day DMA | 712.04 | | 20 day DMA | 660.68 | | 35 day DMA | 577.33 | | 50 day DMA | 508.14 | | 100 day DMA | 348.45 | | 150 day DMA | 254.18 | | 200 day DMA | 194.97 | EMA (exponential moving average) of Euro Asia 530929
| EMA period | EMA current | EMA prev | EMA prev2 | | 5 day EMA | 762.12 | 747.2 | 732.58 | | 12 day EMA | 714.98 | 700.99 | 687.27 | | 20 day EMA | 667.67 | 654.59 | 641.77 | | 35 day EMA | 590.76 | 578.91 | 567.28 | | 50 day EMA | 515.15 | 503.86 | 492.74 |
SMA (simple moving average) of Euro Asia 530929
| SMA period | SMA current | SMA prev | SMA prev2 | | 5 day SMA | 761.55 | 746.65 | 732.04 | | 12 day SMA | 712.04 | 698.11 | 684.45 | | 20 day SMA | 660.68 | 647.75 | 635.08 | | 35 day SMA | 577.33 | 566.03 | 554.96 | | 50 day SMA | 508.14 | 498.2 | 488.46 | | 100 day SMA | 348.45 | 341.61 | 334.91 | | 150 day SMA | 254.18 | 249.06 | 244.04 | | 200 day SMA | 194.97 | 191.1 | 187.3 |
|
|
