RemsonsInd 530919 full analysis,charts,indicators,moving averages,SMA,DMA,EMA,ADX,MACD,RSIRemsons Ind 530919 WideScreen charts, DMA,SMA,EMA technical analysis, forecast prediction, by indicators ADX,MACD,RSI,CCI BSE stock exchange
Daily price and charts and targets RemsonsInd Strong Daily Stock price targets for RemsonsInd 530919 are 123.83 and 127.28 | Daily Target 1 | 123.13 | | Daily Target 2 | 124.52 | | Daily Target 3 | 126.58333333333 | | Daily Target 4 | 127.97 | | Daily Target 5 | 130.03 |
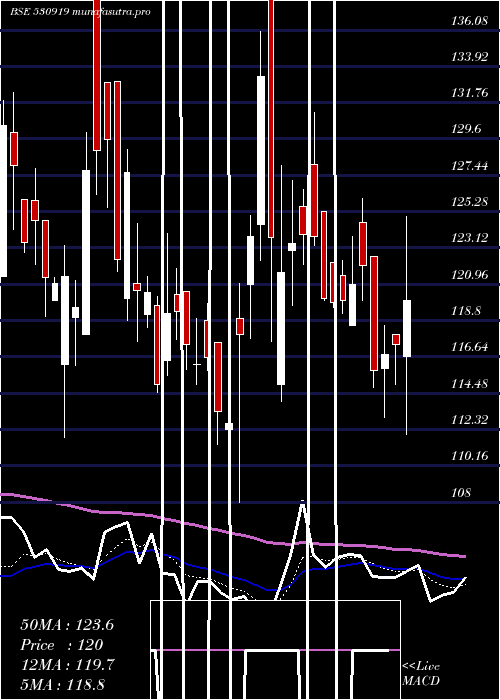
Daily price and volume Remsons Ind
| Date |
Closing |
Open |
Range |
Volume |
Thu 23 October 2025 |
125.90 (-2.06%) |
126.00 |
125.20 - 128.65 |
0.6156 times |
Tue 21 October 2025 |
128.55 (2.39%) |
127.40 |
125.05 - 129.65 |
0.9012 times |
Mon 20 October 2025 |
125.55 (1.87%) |
120.00 |
120.00 - 126.15 |
0.7632 times |
Fri 17 October 2025 |
123.25 (-1.16%) |
124.70 |
122.20 - 126.60 |
0.8284 times |
Thu 16 October 2025 |
124.70 (-0.12%) |
125.00 |
124.20 - 125.50 |
0.1451 times |
Wed 15 October 2025 |
124.85 (0.32%) |
124.00 |
123.25 - 125.00 |
1.0269 times |
Tue 14 October 2025 |
124.45 (-1.97%) |
126.95 |
123.40 - 127.45 |
0.942 times |
Mon 13 October 2025 |
126.95 (-1.86%) |
127.00 |
125.00 - 128.15 |
1.0321 times |
Fri 10 October 2025 |
129.35 (-1.82%) |
131.05 |
128.30 - 131.60 |
1.6035 times |
Thu 09 October 2025 |
131.75 (-1.46%) |
135.75 |
130.90 - 137.05 |
2.142 times |
Wed 08 October 2025 |
133.70 (0.75%) |
131.95 |
131.65 - 134.30 |
1.3245 times |
Weekly price and charts RemsonsInd Strong weekly Stock price targets for RemsonsInd 530919 are 122.95 and 132.6 | Weekly Target 1 | 115.53 | | Weekly Target 2 | 120.72 | | Weekly Target 3 | 125.18333333333 | | Weekly Target 4 | 130.37 | | Weekly Target 5 | 134.83 |
Weekly price and volumes for Remsons Ind
| Date |
Closing |
Open |
Range |
Volume |
Thu 23 October 2025 |
125.90 (2.15%) |
120.00 |
120.00 - 129.65 |
0.2181 times |
Fri 17 October 2025 |
123.25 (-4.72%) |
127.00 |
122.20 - 128.15 |
0.3802 times |
Fri 10 October 2025 |
129.35 (0.54%) |
131.25 |
127.00 - 137.45 |
1.007 times |
Fri 03 October 2025 |
128.65 (5.19%) |
123.95 |
118.15 - 129.50 |
0.4454 times |
Fri 26 September 2025 |
122.30 (-2.9%) |
130.00 |
120.65 - 138.95 |
2.9904 times |
Fri 19 September 2025 |
125.95 (0.96%) |
126.95 |
123.65 - 131.00 |
0.7712 times |
Fri 12 September 2025 |
124.75 (-0.2%) |
126.00 |
120.00 - 129.80 |
1.0694 times |
Fri 05 September 2025 |
125.00 (4.43%) |
121.00 |
119.05 - 132.10 |
0.9597 times |
Fri 29 August 2025 |
119.70 (-2.76%) |
124.15 |
115.65 - 126.20 |
0.6158 times |
Fri 22 August 2025 |
123.10 (0.2%) |
126.00 |
122.45 - 133.20 |
1.5428 times |
Thu 14 August 2025 |
122.85 (5.45%) |
115.90 |
110.90 - 133.55 |
1.8916 times |

Monthly price and charts RemsonsInd Strong monthly Stock price targets for RemsonsInd 530919 are 122.85 and 140.5 | Monthly Target 1 | 110.07 | | Monthly Target 2 | 117.98 | | Monthly Target 3 | 127.71666666667 | | Monthly Target 4 | 135.63 | | Monthly Target 5 | 145.37 |
Monthly price and volumes Remsons Ind
| Date |
Closing |
Open |
Range |
Volume |
Thu 23 October 2025 |
125.90 (5.4%) |
119.80 |
119.80 - 137.45 |
0.2568 times |
Tue 30 September 2025 |
119.45 (-0.21%) |
121.00 |
118.15 - 138.95 |
0.8497 times |
Fri 29 August 2025 |
119.70 (-4.77%) |
126.05 |
110.90 - 133.55 |
0.8433 times |
Thu 31 July 2025 |
125.70 (-8.55%) |
139.45 |
122.30 - 141.95 |
2.1008 times |
Mon 30 June 2025 |
137.45 (-4.98%) |
140.30 |
130.05 - 157.00 |
2.3098 times |
Fri 30 May 2025 |
144.65 (20.54%) |
120.00 |
102.30 - 155.00 |
2.29 times |
Wed 30 April 2025 |
120.00 (1.69%) |
120.95 |
112.00 - 139.90 |
0.4326 times |
Fri 28 March 2025 |
118.00 (-2.48%) |
116.20 |
108.00 - 142.00 |
0.2338 times |
Fri 28 February 2025 |
121.00 (3.77%) |
119.50 |
102.90 - 132.35 |
0.4334 times |
Fri 31 January 2025 |
116.60 (-20.3%) |
149.80 |
109.50 - 152.75 |
0.2499 times |
Tue 31 December 2024 |
146.30 (-9.13%) |
159.15 |
143.90 - 175.80 |
0.3591 times |

DMA SMA EMA moving averages of Remsons Ind 530919
DMA (daily moving average) of Remsons Ind 530919
| DMA period | DMA value | | 5 day DMA | 125.59 | | 12 day DMA | 127.64 | | 20 day DMA | 126.32 | | 35 day DMA | 125.94 | | 50 day DMA | 125.35 | | 100 day DMA | 129.95 | | 150 day DMA | 128.19 | | 200 day DMA | 128.32 | EMA (exponential moving average) of Remsons Ind 530919
| EMA period | EMA current | EMA prev | EMA prev2 | | 5 day EMA | 126.19 | 126.34 | 125.23 | | 12 day EMA | 126.37 | 126.46 | 126.08 | | 20 day EMA | 126.31 | 126.35 | 126.12 | | 35 day EMA | 125.7 | 125.69 | 125.52 | | 50 day EMA | 125.03 | 124.99 | 124.84 |
SMA (simple moving average) of Remsons Ind 530919
| SMA period | SMA current | SMA prev | SMA prev2 | | 5 day SMA | 125.59 | 125.38 | 124.56 | | 12 day SMA | 127.64 | 127.75 | 127.75 | | 20 day SMA | 126.32 | 126.68 | 126.61 | | 35 day SMA | 125.94 | 125.83 | 125.67 | | 50 day SMA | 125.35 | 125.16 | 124.91 | | 100 day SMA | 129.95 | 130.14 | 130.31 | | 150 day SMA | 128.19 | 128.21 | 128.21 | | 200 day SMA | 128.32 | 128.45 | 128.55 |
|
|
