GowraLeasng 530709 full analysis,charts,indicators,moving averages,SMA,DMA,EMA,ADX,MACD,RSIGowra Leasng 530709 WideScreen charts, DMA,SMA,EMA technical analysis, forecast prediction, by indicators ADX,MACD,RSI,CCI BSE stock exchange
Daily price and charts and targets GowraLeasng Strong Daily Stock price targets for GowraLeasng 530709 are 104 and 112 | Daily Target 1 | 97.33 | | Daily Target 2 | 102.67 | | Daily Target 3 | 105.33333333333 | | Daily Target 4 | 110.67 | | Daily Target 5 | 113.33 |
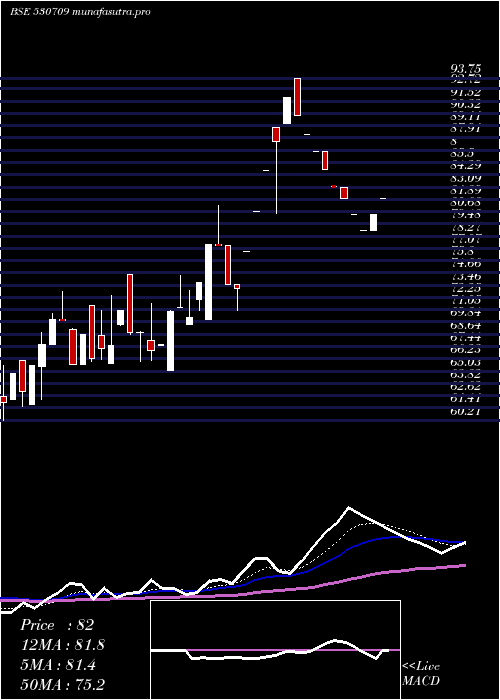
Daily price and volume Gowra Leasng
| Date |
Closing |
Open |
Range |
Volume |
Fri 05 December 2025 |
108.00 (6.56%) |
107.00 |
100.00 - 108.00 |
0.6744 times |
Thu 04 December 2025 |
101.35 (-4.21%) |
105.80 |
100.55 - 105.80 |
0.1492 times |
Wed 03 December 2025 |
105.80 (0.52%) |
106.35 |
100.05 - 106.40 |
0.5786 times |
Tue 02 December 2025 |
105.25 (-0.05%) |
107.00 |
105.20 - 107.00 |
0.158 times |
Mon 01 December 2025 |
105.30 (1.77%) |
104.00 |
104.00 - 106.00 |
0.6553 times |
Fri 28 November 2025 |
103.47 (-2.17%) |
100.70 |
100.70 - 110.70 |
0.7506 times |
Thu 27 November 2025 |
105.77 (-2.94%) |
108.97 |
103.53 - 109.20 |
1.8516 times |
Wed 26 November 2025 |
108.97 (3.78%) |
105.00 |
105.00 - 110.00 |
1.5221 times |
Tue 25 November 2025 |
105.00 (2.28%) |
107.79 |
102.66 - 107.79 |
0.5554 times |
Mon 24 November 2025 |
102.66 (-4.94%) |
106.00 |
102.60 - 106.00 |
3.105 times |
Fri 21 November 2025 |
108.00 (0.01%) |
108.50 |
103.00 - 108.50 |
1.6322 times |
Weekly price and charts GowraLeasng Strong weekly Stock price targets for GowraLeasng 530709 are 104 and 112 | Weekly Target 1 | 97.33 | | Weekly Target 2 | 102.67 | | Weekly Target 3 | 105.33333333333 | | Weekly Target 4 | 110.67 | | Weekly Target 5 | 113.33 |
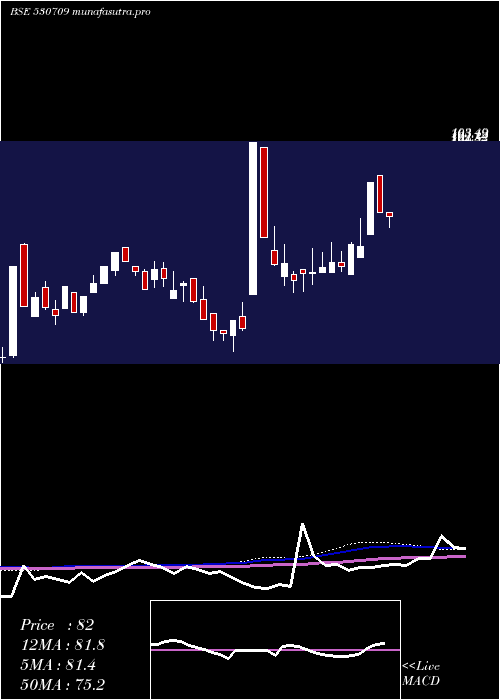
Weekly price and volumes for Gowra Leasng
| Date |
Closing |
Open |
Range |
Volume |
Fri 05 December 2025 |
108.00 (4.38%) |
104.00 |
100.00 - 108.00 |
0.3304 times |
Fri 28 November 2025 |
103.47 (-4.19%) |
106.00 |
100.70 - 110.70 |
1.161 times |
Fri 21 November 2025 |
108.00 (-3.03%) |
108.58 |
103.00 - 114.00 |
0.8516 times |
Fri 14 November 2025 |
111.37 (2.58%) |
110.95 |
104.80 - 113.99 |
1.7194 times |
Fri 07 November 2025 |
108.57 (12.31%) |
101.50 |
99.49 - 108.57 |
1.6783 times |
Fri 31 October 2025 |
96.67 (1.23%) |
98.61 |
93.00 - 99.50 |
0.6931 times |
Thu 23 October 2025 |
95.50 (-3.25%) |
97.20 |
93.90 - 99.20 |
0.7247 times |
Fri 17 October 2025 |
98.71 (0.01%) |
94.00 |
92.00 - 103.63 |
1.4371 times |
Fri 10 October 2025 |
98.70 (0.29%) |
97.45 |
89.78 - 99.90 |
0.8522 times |
Fri 03 October 2025 |
98.41 (-1.49%) |
97.90 |
95.00 - 100.40 |
0.5524 times |
Fri 26 September 2025 |
99.90 (1.89%) |
95.00 |
93.65 - 101.50 |
0.6533 times |
Monthly price and charts GowraLeasng Strong monthly Stock price targets for GowraLeasng 530709 are 104 and 112 | Monthly Target 1 | 97.33 | | Monthly Target 2 | 102.67 | | Monthly Target 3 | 105.33333333333 | | Monthly Target 4 | 110.67 | | Monthly Target 5 | 113.33 |
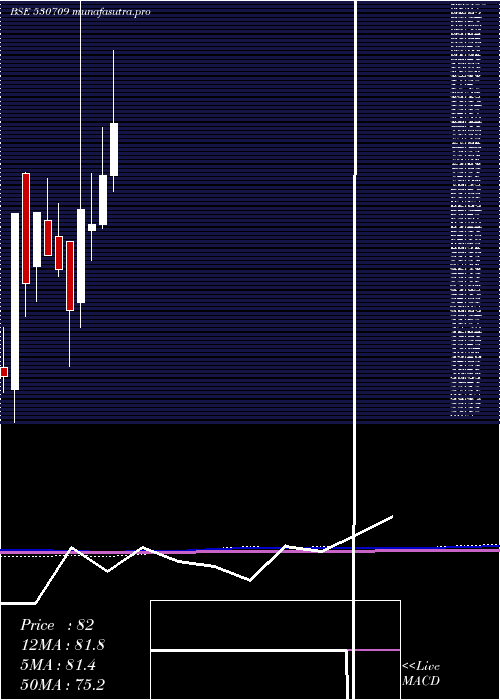
Monthly price and volumes Gowra Leasng
| Date |
Closing |
Open |
Range |
Volume |
Fri 05 December 2025 |
108.00 (4.38%) |
104.00 |
100.00 - 108.00 |
0.0746 times |
Fri 28 November 2025 |
103.47 (7.03%) |
101.50 |
99.49 - 114.00 |
1.2215 times |
Fri 31 October 2025 |
96.67 (-3.28%) |
99.95 |
89.78 - 103.63 |
0.8582 times |
Tue 30 September 2025 |
99.95 (-2.49%) |
100.50 |
90.80 - 106.50 |
1.0196 times |
Fri 29 August 2025 |
102.50 (-21.23%) |
130.10 |
85.70 - 136.60 |
2.8976 times |
Thu 31 July 2025 |
130.12 (48.45%) |
85.90 |
84.00 - 151.79 |
2.1472 times |
Mon 30 June 2025 |
87.65 (3.12%) |
85.00 |
84.00 - 106.99 |
0.665 times |
Fri 30 May 2025 |
85.00 (15.61%) |
73.52 |
71.00 - 93.75 |
0.4382 times |
Wed 30 April 2025 |
73.52 (11.99%) |
65.70 |
65.05 - 81.29 |
0.3195 times |
Fri 28 March 2025 |
65.65 (-3.46%) |
64.60 |
59.80 - 73.80 |
0.3586 times |
Fri 28 February 2025 |
68.00 (31.32%) |
53.00 |
48.98 - 103.49 |
3.1535 times |
DMA SMA EMA moving averages of Gowra Leasng 530709
DMA (daily moving average) of Gowra Leasng 530709
| DMA period | DMA value | | 5 day DMA | 105.14 | | 12 day DMA | 105.63 | | 20 day DMA | 107.53 | | 35 day DMA | 103.46 | | 50 day DMA | 101.98 | | 100 day DMA | 106.72 | | 150 day DMA | 100.48 | | 200 day DMA | 92.84 | EMA (exponential moving average) of Gowra Leasng 530709
| EMA period | EMA current | EMA prev | EMA prev2 | | 5 day EMA | 105.44 | 104.16 | 105.56 | | 12 day EMA | 105.7 | 105.28 | 105.99 | | 20 day EMA | 105.38 | 105.1 | 105.49 | | 35 day EMA | 104.08 | 103.85 | 104 | | 50 day EMA | 101.88 | 101.63 | 101.64 |
SMA (simple moving average) of Gowra Leasng 530709
| SMA period | SMA current | SMA prev | SMA prev2 | | 5 day SMA | 105.14 | 104.23 | 105.12 | | 12 day SMA | 105.63 | 105.92 | 106.89 | | 20 day SMA | 107.53 | 107.3 | 107.48 | | 35 day SMA | 103.46 | 103.3 | 103.23 | | 50 day SMA | 101.98 | 101.79 | 101.71 | | 100 day SMA | 106.72 | 106.65 | 106.56 | | 150 day SMA | 100.48 | 100.27 | 100.09 | | 200 day SMA | 92.84 | 92.56 | 92.31 |
|
|
