SiddhaVen 530439 full analysis,charts,indicators,moving averages,SMA,DMA,EMA,ADX,MACD,RSISiddha Ven 530439 WideScreen charts, DMA,SMA,EMA technical analysis, forecast prediction, by indicators ADX,MACD,RSI,CCI BSE stock exchange
Daily price and charts and targets SiddhaVen Strong Daily Stock price targets for SiddhaVen 530439 are 6.12 and 6.12 | Daily Target 1 | 6.12 | | Daily Target 2 | 6.12 | | Daily Target 3 | 6.12 | | Daily Target 4 | 6.12 | | Daily Target 5 | 6.12 |
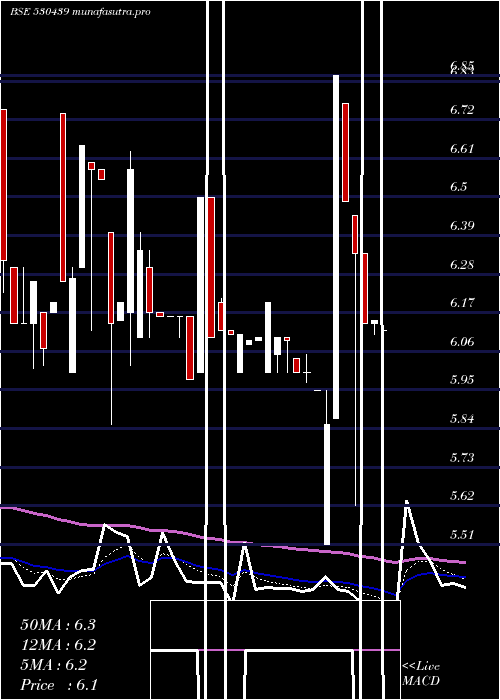
Daily price and volume Siddha Ven
| Date |
Closing |
Open |
Range |
Volume |
Tue 21 October 2025 |
6.12 (-0.49%) |
6.12 |
6.12 - 6.12 |
0.2462 times |
Mon 20 October 2025 |
6.15 (0.16%) |
6.14 |
6.11 - 6.15 |
0.5155 times |
Fri 17 October 2025 |
6.14 (-3.15%) |
6.34 |
6.14 - 6.34 |
1.3593 times |
Thu 16 October 2025 |
6.34 (-2.31%) |
6.45 |
5.62 - 6.45 |
0.4649 times |
Wed 15 October 2025 |
6.49 (-5.26%) |
6.77 |
6.49 - 6.77 |
0.7761 times |
Tue 14 October 2025 |
6.85 (17.09%) |
5.87 |
5.87 - 6.85 |
0.5674 times |
Mon 13 October 2025 |
5.85 (-1.68%) |
5.51 |
5.51 - 5.95 |
0.4696 times |
Fri 10 October 2025 |
5.95 (-0.83%) |
5.95 |
5.95 - 5.95 |
1.1007 times |
Thu 09 October 2025 |
6.00 (0%) |
6.00 |
5.97 - 6.05 |
4.017 times |
Wed 08 October 2025 |
6.00 (-1.48%) |
6.04 |
6.00 - 6.04 |
0.483 times |
Tue 07 October 2025 |
6.09 (-0.16%) |
6.10 |
6.00 - 6.10 |
0.7329 times |
Weekly price and charts SiddhaVen Strong weekly Stock price targets for SiddhaVen 530439 are 6.1 and 6.14 | Weekly Target 1 | 6.09 | | Weekly Target 2 | 6.1 | | Weekly Target 3 | 6.1266666666667 | | Weekly Target 4 | 6.14 | | Weekly Target 5 | 6.17 |
Weekly price and volumes for Siddha Ven
| Date |
Closing |
Open |
Range |
Volume |
Tue 21 October 2025 |
6.12 (-0.33%) |
6.14 |
6.11 - 6.15 |
0.1602 times |
Fri 17 October 2025 |
6.14 (3.19%) |
5.51 |
5.51 - 6.85 |
0.7648 times |
Fri 10 October 2025 |
5.95 (-4.03%) |
6.05 |
5.95 - 6.10 |
1.5825 times |
Fri 03 October 2025 |
6.20 (1.47%) |
6.00 |
6.00 - 6.20 |
0.3307 times |
Fri 26 September 2025 |
6.11 (-0.81%) |
6.16 |
5.98 - 6.50 |
1.8203 times |
Fri 19 September 2025 |
6.16 (-6.38%) |
6.10 |
6.10 - 6.40 |
1.262 times |
Fri 12 September 2025 |
6.58 (-1.05%) |
6.60 |
5.85 - 6.63 |
0.9549 times |
Fri 05 September 2025 |
6.65 (6.23%) |
6.17 |
6.00 - 6.74 |
1.0384 times |
Fri 29 August 2025 |
6.26 (-3.69%) |
6.75 |
6.01 - 6.75 |
1.2464 times |
Fri 22 August 2025 |
6.50 (6.21%) |
6.15 |
6.05 - 6.99 |
0.8398 times |
Thu 14 August 2025 |
6.12 (1.83%) |
6.01 |
6.01 - 6.90 |
0.7726 times |

Monthly price and charts SiddhaVen Strong monthly Stock price targets for SiddhaVen 530439 are 5.82 and 7.16 | Monthly Target 1 | 4.82 | | Monthly Target 2 | 5.47 | | Monthly Target 3 | 6.16 | | Monthly Target 4 | 6.81 | | Monthly Target 5 | 7.5 |
Monthly price and volumes Siddha Ven
| Date |
Closing |
Open |
Range |
Volume |
Tue 21 October 2025 |
6.12 (0.49%) |
6.09 |
5.51 - 6.85 |
0.2169 times |
Tue 30 September 2025 |
6.09 (-2.72%) |
6.17 |
5.85 - 6.74 |
0.4131 times |
Fri 29 August 2025 |
6.26 (-6.01%) |
6.01 |
6.01 - 6.99 |
0.4232 times |
Thu 31 July 2025 |
6.66 (-11.2%) |
7.44 |
6.51 - 7.94 |
0.6322 times |
Mon 30 June 2025 |
7.50 (-0.27%) |
7.50 |
6.60 - 8.12 |
1.6461 times |
Fri 30 May 2025 |
7.52 (5.47%) |
7.13 |
6.82 - 7.93 |
1.1961 times |
Wed 30 April 2025 |
7.13 (-5.94%) |
7.58 |
6.92 - 7.78 |
1.3794 times |
Fri 28 March 2025 |
7.58 (2.16%) |
7.42 |
7.05 - 8.59 |
1.1972 times |
Fri 28 February 2025 |
7.42 (-36.42%) |
11.64 |
7.14 - 12.56 |
1.2952 times |
Fri 31 January 2025 |
11.67 (-6.04%) |
12.56 |
11.03 - 14.62 |
1.6008 times |
Tue 31 December 2024 |
12.42 (-24.27%) |
15.58 |
12.16 - 16.98 |
7.2058 times |

DMA SMA EMA moving averages of Siddha Ven 530439
DMA (daily moving average) of Siddha Ven 530439
| DMA period | DMA value | | 5 day DMA | 6.25 | | 12 day DMA | 6.17 | | 20 day DMA | 6.17 | | 35 day DMA | 6.22 | | 50 day DMA | 6.23 | | 100 day DMA | 6.68 | | 150 day DMA | 6.97 | | 200 day DMA | 8.02 | EMA (exponential moving average) of Siddha Ven 530439
| EMA period | EMA current | EMA prev | EMA prev2 | | 5 day EMA | 6.19 | 6.23 | 6.27 | | 12 day EMA | 6.2 | 6.21 | 6.22 | | 20 day EMA | 6.19 | 6.2 | 6.2 | | 35 day EMA | 6.21 | 6.22 | 6.22 | | 50 day EMA | 6.24 | 6.25 | 6.25 |
SMA (simple moving average) of Siddha Ven 530439
| SMA period | SMA current | SMA prev | SMA prev2 | | 5 day SMA | 6.25 | 6.39 | 6.33 | | 12 day SMA | 6.17 | 6.18 | 6.18 | | 20 day SMA | 6.17 | 6.16 | 6.16 | | 35 day SMA | 6.22 | 6.22 | 6.23 | | 50 day SMA | 6.23 | 6.24 | 6.25 | | 100 day SMA | 6.68 | 6.7 | 6.71 | | 150 day SMA | 6.97 | 6.98 | 6.98 | | 200 day SMA | 8.02 | 8.06 | 8.1 |
|
|
