RisaIntl 530251 full analysis,charts,indicators,moving averages,SMA,DMA,EMA,ADX,MACD,RSIRisa Intl 530251 WideScreen charts, DMA,SMA,EMA technical analysis, forecast prediction, by indicators ADX,MACD,RSI,CCI BSE stock exchange
Daily price and charts and targets RisaIntl Strong Daily Stock price targets for RisaIntl 530251 are 0.75 and 0.81 | Daily Target 1 | 0.73 | | Daily Target 2 | 0.76 | | Daily Target 3 | 0.79 | | Daily Target 4 | 0.82 | | Daily Target 5 | 0.85 |
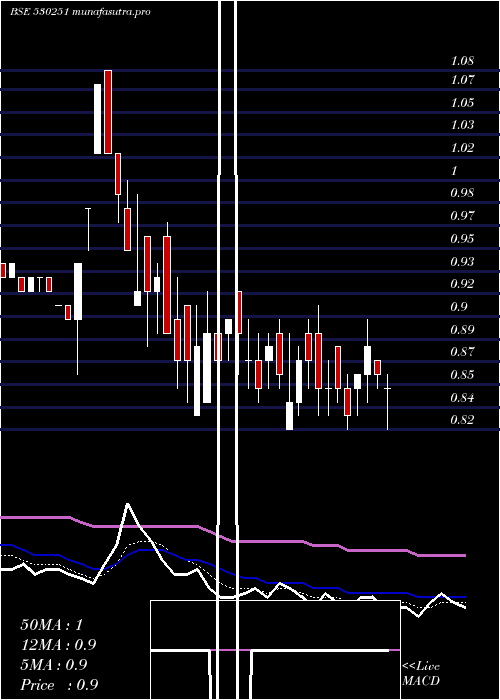
Daily price and volume Risa Intl
| Date |
Closing |
Open |
Range |
Volume |
Thu 23 October 2025 |
0.79 (-1.25%) |
0.80 |
0.76 - 0.82 |
0.6838 times |
Tue 21 October 2025 |
0.80 (2.56%) |
0.80 |
0.75 - 0.80 |
0.1533 times |
Mon 20 October 2025 |
0.78 (1.3%) |
0.75 |
0.75 - 0.79 |
0.4109 times |
Fri 17 October 2025 |
0.77 (-1.28%) |
0.79 |
0.75 - 0.81 |
0.8599 times |
Thu 16 October 2025 |
0.78 (-1.27%) |
0.82 |
0.78 - 0.82 |
1.19 times |
Wed 15 October 2025 |
0.79 (0%) |
0.80 |
0.76 - 0.82 |
0.2815 times |
Tue 14 October 2025 |
0.79 (-3.66%) |
0.82 |
0.78 - 0.85 |
1.0439 times |
Mon 13 October 2025 |
0.82 (-4.65%) |
0.82 |
0.82 - 0.87 |
0.5373 times |
Fri 10 October 2025 |
0.86 (-1.15%) |
0.85 |
0.83 - 0.90 |
0.5212 times |
Thu 09 October 2025 |
0.87 (1.16%) |
0.84 |
0.82 - 0.88 |
4.3181 times |
Wed 08 October 2025 |
0.86 (2.38%) |
0.88 |
0.85 - 0.88 |
1.1946 times |
Weekly price and charts RisaIntl Strong weekly Stock price targets for RisaIntl 530251 are 0.77 and 0.84 | Weekly Target 1 | 0.72 | | Weekly Target 2 | 0.75 | | Weekly Target 3 | 0.78666666666667 | | Weekly Target 4 | 0.82 | | Weekly Target 5 | 0.86 |
Weekly price and volumes for Risa Intl
| Date |
Closing |
Open |
Range |
Volume |
Thu 23 October 2025 |
0.79 (2.6%) |
0.75 |
0.75 - 0.82 |
0.1783 times |
Fri 17 October 2025 |
0.77 (-10.47%) |
0.82 |
0.75 - 0.87 |
0.5589 times |
Fri 10 October 2025 |
0.86 (11.69%) |
0.78 |
0.77 - 0.90 |
1.0971 times |
Fri 03 October 2025 |
0.77 (-8.33%) |
0.82 |
0.73 - 0.83 |
0.6536 times |
Fri 26 September 2025 |
0.84 (23.53%) |
0.69 |
0.68 - 1.04 |
4.102 times |
Fri 19 September 2025 |
0.68 (0%) |
0.68 |
0.66 - 0.70 |
0.604 times |
Fri 12 September 2025 |
0.68 (0%) |
0.68 |
0.64 - 0.70 |
0.9472 times |
Fri 05 September 2025 |
0.68 (3.03%) |
0.68 |
0.63 - 0.70 |
0.793 times |
Fri 29 August 2025 |
0.66 (-4.35%) |
0.71 |
0.64 - 0.72 |
0.3664 times |
Fri 22 August 2025 |
0.69 (1.47%) |
0.75 |
0.62 - 0.75 |
0.6994 times |
Thu 14 August 2025 |
0.68 (1.49%) |
0.70 |
0.57 - 0.72 |
0.4849 times |

Monthly price and charts RisaIntl Strong monthly Stock price targets for RisaIntl 530251 are 0.76 and 0.93 | Monthly Target 1 | 0.64 | | Monthly Target 2 | 0.71 | | Monthly Target 3 | 0.80666666666667 | | Monthly Target 4 | 0.88 | | Monthly Target 5 | 0.98 |
Monthly price and volumes Risa Intl
| Date |
Closing |
Open |
Range |
Volume |
Thu 23 October 2025 |
0.79 (5.33%) |
0.76 |
0.73 - 0.90 |
0.9388 times |
Tue 30 September 2025 |
0.75 (13.64%) |
0.68 |
0.63 - 1.04 |
2.9937 times |
Fri 29 August 2025 |
0.66 (-4.35%) |
0.69 |
0.57 - 0.76 |
1.1347 times |
Thu 31 July 2025 |
0.69 (-22.47%) |
0.88 |
0.68 - 0.96 |
1.0506 times |
Mon 30 June 2025 |
0.89 (7.23%) |
0.85 |
0.82 - 0.99 |
1.1192 times |
Fri 30 May 2025 |
0.83 (-9.78%) |
0.96 |
0.82 - 0.97 |
0.9096 times |
Wed 30 April 2025 |
0.92 (-3.16%) |
0.94 |
0.86 - 1.08 |
0.391 times |
Fri 28 March 2025 |
0.95 (4.4%) |
0.90 |
0.87 - 1.13 |
0.3558 times |
Fri 28 February 2025 |
0.91 (-22.22%) |
1.13 |
0.91 - 1.15 |
0.3057 times |
Fri 31 January 2025 |
1.17 (6.36%) |
1.10 |
1.01 - 1.35 |
0.801 times |
Tue 31 December 2024 |
1.10 (-5.17%) |
1.18 |
1.10 - 1.35 |
1.5092 times |

DMA SMA EMA moving averages of Risa Intl 530251
DMA (daily moving average) of Risa Intl 530251
| DMA period | DMA value | | 5 day DMA | 0.78 | | 12 day DMA | 0.81 | | 20 day DMA | 0.81 | | 35 day DMA | 0.77 | | 50 day DMA | 0.74 | | 100 day DMA | 0.79 | | 150 day DMA | 0.84 | | 200 day DMA | 0.91 | EMA (exponential moving average) of Risa Intl 530251
| EMA period | EMA current | EMA prev | EMA prev2 | | 5 day EMA | 0.79 | 0.79 | 0.79 | | 12 day EMA | 0.8 | 0.8 | 0.8 | | 20 day EMA | 0.8 | 0.8 | 0.8 | | 35 day EMA | 0.77 | 0.77 | 0.77 | | 50 day EMA | 0.73 | 0.73 | 0.73 |
SMA (simple moving average) of Risa Intl 530251
| SMA period | SMA current | SMA prev | SMA prev2 | | 5 day SMA | 0.78 | 0.78 | 0.78 | | 12 day SMA | 0.81 | 0.81 | 0.81 | | 20 day SMA | 0.81 | 0.82 | 0.82 | | 35 day SMA | 0.77 | 0.76 | 0.76 | | 50 day SMA | 0.74 | 0.74 | 0.74 | | 100 day SMA | 0.79 | 0.8 | 0.8 | | 150 day SMA | 0.84 | 0.85 | 0.85 | | 200 day SMA | 0.91 | 0.91 | 0.91 |
|
|
