OdysseyTech 530175 full analysis,charts,indicators,moving averages,SMA,DMA,EMA,ADX,MACD,RSIOdyssey Tech 530175 WideScreen charts, DMA,SMA,EMA technical analysis, forecast prediction, by indicators ADX,MACD,RSI,CCI BSE stock exchange
Daily price and charts and targets OdysseyTech Strong Daily Stock price targets for OdysseyTech 530175 are 81.17 and 93.04 | Daily Target 1 | 72.9 | | Daily Target 2 | 77.56 | | Daily Target 3 | 84.773333333333 | | Daily Target 4 | 89.43 | | Daily Target 5 | 96.64 |
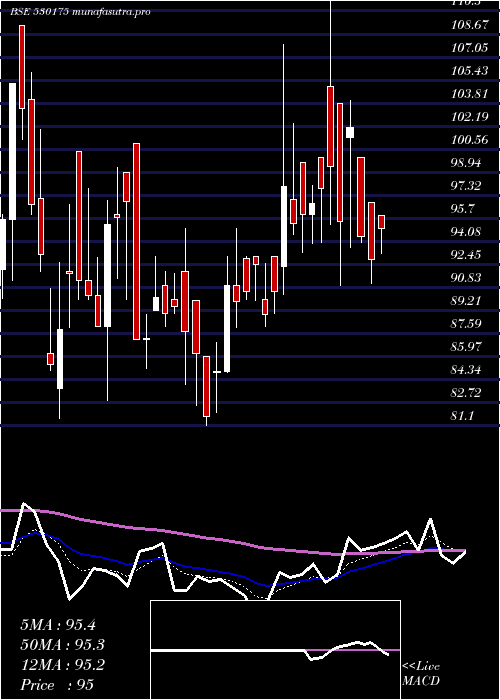
Daily price and volume Odyssey Tech
| Date |
Closing |
Open |
Range |
Volume |
Thu 23 October 2025 |
82.21 (0.71%) |
80.12 |
80.12 - 91.99 |
1.8553 times |
Tue 21 October 2025 |
81.63 (1.08%) |
81.00 |
80.01 - 82.90 |
0.2152 times |
Mon 20 October 2025 |
80.76 (0.56%) |
83.80 |
80.00 - 83.80 |
1.1091 times |
Fri 17 October 2025 |
80.31 (-1.74%) |
83.90 |
79.05 - 83.90 |
0.8638 times |
Thu 16 October 2025 |
81.73 (-2.69%) |
83.58 |
80.00 - 83.58 |
0.5534 times |
Wed 15 October 2025 |
83.99 (0.16%) |
85.00 |
80.46 - 85.00 |
0.4524 times |
Tue 14 October 2025 |
83.86 (4.15%) |
83.49 |
79.00 - 84.99 |
1.1625 times |
Mon 13 October 2025 |
80.52 (-2.2%) |
85.00 |
79.60 - 85.00 |
0.7706 times |
Fri 10 October 2025 |
82.33 (1.74%) |
79.50 |
79.50 - 83.84 |
1.7242 times |
Thu 09 October 2025 |
80.92 (1.99%) |
79.99 |
77.90 - 83.00 |
1.2936 times |
Wed 08 October 2025 |
79.34 (0.38%) |
78.80 |
78.10 - 82.00 |
0.7597 times |
Weekly price and charts OdysseyTech Strong weekly Stock price targets for OdysseyTech 530175 are 75.11 and 87.1 | Weekly Target 1 | 72.74 | | Weekly Target 2 | 77.48 | | Weekly Target 3 | 84.733333333333 | | Weekly Target 4 | 89.47 | | Weekly Target 5 | 96.72 |
Weekly price and volumes for Odyssey Tech
| Date |
Closing |
Open |
Range |
Volume |
Thu 23 October 2025 |
82.21 (2.37%) |
83.80 |
80.00 - 91.99 |
0.4519 times |
Fri 17 October 2025 |
80.31 (-2.45%) |
85.00 |
79.00 - 85.00 |
0.5404 times |
Fri 10 October 2025 |
82.33 (1.04%) |
81.48 |
77.90 - 83.84 |
0.88 times |
Fri 03 October 2025 |
81.48 (4.17%) |
78.22 |
75.06 - 82.85 |
1.4297 times |
Fri 26 September 2025 |
78.22 (-2.2%) |
78.50 |
76.50 - 82.90 |
1.1942 times |
Fri 19 September 2025 |
79.98 (1.64%) |
77.10 |
77.10 - 81.40 |
1.1495 times |
Fri 12 September 2025 |
78.69 (-5.07%) |
79.00 |
78.00 - 85.99 |
1.2867 times |
Fri 05 September 2025 |
82.89 (3.66%) |
80.99 |
78.22 - 83.59 |
0.2919 times |
Fri 29 August 2025 |
79.96 (6.51%) |
74.06 |
74.06 - 81.89 |
0.5942 times |
Fri 22 August 2025 |
75.07 (-1.29%) |
76.50 |
73.06 - 76.94 |
2.1814 times |
Thu 14 August 2025 |
76.05 (-10.45%) |
88.00 |
74.41 - 88.00 |
3.634 times |

Monthly price and charts OdysseyTech Strong monthly Stock price targets for OdysseyTech 530175 are 79.61 and 94.59 | Monthly Target 1 | 68.76 | | Monthly Target 2 | 75.48 | | Monthly Target 3 | 83.736666666667 | | Monthly Target 4 | 90.46 | | Monthly Target 5 | 98.72 |
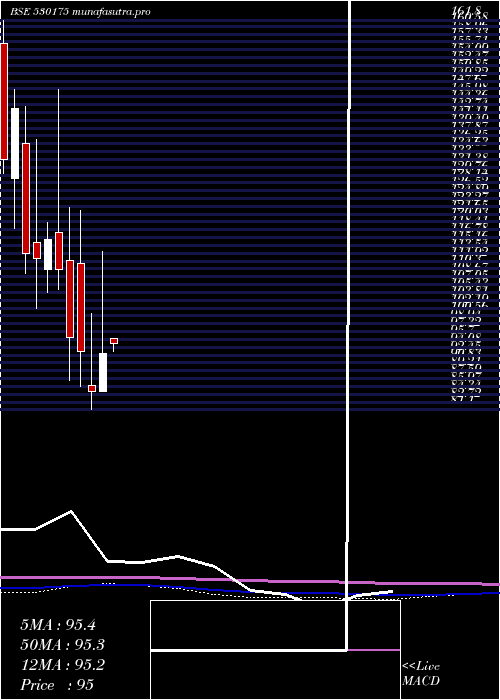
Monthly price and volumes Odyssey Tech
| Date |
Closing |
Open |
Range |
Volume |
Thu 23 October 2025 |
82.21 (6.63%) |
78.80 |
77.01 - 91.99 |
0.3348 times |
Tue 30 September 2025 |
77.10 (-3.58%) |
80.99 |
75.06 - 85.99 |
0.6773 times |
Fri 29 August 2025 |
79.96 (-9.65%) |
89.89 |
73.06 - 95.89 |
1.1477 times |
Thu 31 July 2025 |
88.50 (-8.24%) |
95.97 |
83.30 - 103.99 |
0.7338 times |
Mon 30 June 2025 |
96.45 (-12.79%) |
107.20 |
94.85 - 112.00 |
1.1453 times |
Fri 30 May 2025 |
110.59 (19.2%) |
95.90 |
80.00 - 114.40 |
2.2262 times |
Wed 30 April 2025 |
92.78 (9.22%) |
84.95 |
84.90 - 114.00 |
0.753 times |
Fri 28 March 2025 |
84.95 (-8.82%) |
86.22 |
81.10 - 100.98 |
1.2171 times |
Fri 28 February 2025 |
93.17 (-3%) |
111.50 |
86.05 - 122.40 |
0.7861 times |
Fri 31 January 2025 |
96.05 (-12.76%) |
112.00 |
87.20 - 123.00 |
0.9787 times |
Tue 31 December 2024 |
110.10 (-5.49%) |
117.85 |
106.05 - 147.45 |
1.0246 times |
DMA SMA EMA moving averages of Odyssey Tech 530175
DMA (daily moving average) of Odyssey Tech 530175
| DMA period | DMA value | | 5 day DMA | 81.33 | | 12 day DMA | 81.39 | | 20 day DMA | 80.28 | | 35 day DMA | 80.32 | | 50 day DMA | 79.61 | | 100 day DMA | 88.5 | | 150 day DMA | 89.55 | | 200 day DMA | 92.2 | EMA (exponential moving average) of Odyssey Tech 530175
| EMA period | EMA current | EMA prev | EMA prev2 | | 5 day EMA | 81.68 | 81.42 | 81.31 | | 12 day EMA | 81.28 | 81.11 | 81.01 | | 20 day EMA | 80.87 | 80.73 | 80.63 | | 35 day EMA | 80.55 | 80.45 | 80.38 | | 50 day EMA | 80.31 | 80.23 | 80.17 |
SMA (simple moving average) of Odyssey Tech 530175
| SMA period | SMA current | SMA prev | SMA prev2 | | 5 day SMA | 81.33 | 81.68 | 82.13 | | 12 day SMA | 81.39 | 81.29 | 81.27 | | 20 day SMA | 80.28 | 80.02 | 79.82 | | 35 day SMA | 80.32 | 80.25 | 80.16 | | 50 day SMA | 79.61 | 79.67 | 79.75 | | 100 day SMA | 88.5 | 88.69 | 88.84 | | 150 day SMA | 89.55 | 89.62 | 89.68 | | 200 day SMA | 92.2 | 92.37 | 92.54 |
|
|
