AmcoIndia 530133 full analysis,charts,indicators,moving averages,SMA,DMA,EMA,ADX,MACD,RSIAmco India 530133 WideScreen charts, DMA,SMA,EMA technical analysis, forecast prediction, by indicators ADX,MACD,RSI,CCI BSE stock exchange
Daily price and charts and targets AmcoIndia Strong Daily Stock price targets for AmcoIndia 530133 are 86.37 and 94.07 | Daily Target 1 | 84.75 | | Daily Target 2 | 87.99 | | Daily Target 3 | 92.446666666667 | | Daily Target 4 | 95.69 | | Daily Target 5 | 100.15 |
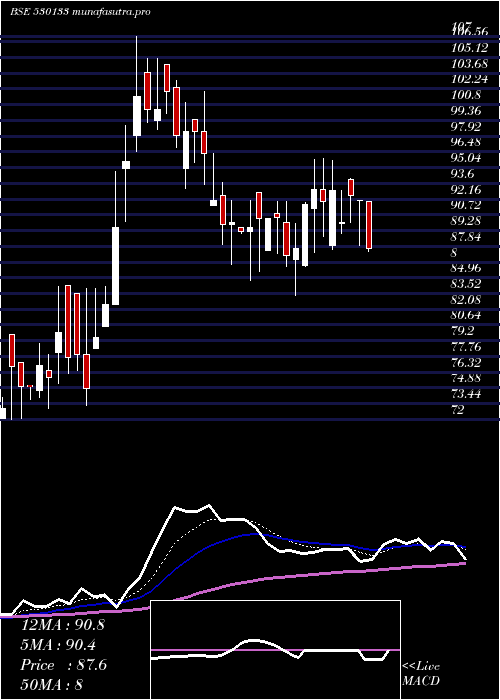
Daily price and volume Amco India
| Date |
Closing |
Open |
Range |
Volume |
Tue 21 October 2025 |
91.24 (-3.95%) |
96.89 |
89.20 - 96.90 |
1.7353 times |
Mon 20 October 2025 |
94.99 (3.4%) |
97.00 |
91.00 - 97.00 |
0.436 times |
Fri 17 October 2025 |
91.87 (5.6%) |
93.55 |
87.00 - 93.55 |
1.9048 times |
Thu 16 October 2025 |
87.00 (1.15%) |
95.30 |
85.05 - 95.30 |
0.2058 times |
Wed 15 October 2025 |
86.01 (-4.43%) |
85.50 |
85.30 - 88.20 |
0.727 times |
Tue 14 October 2025 |
90.00 (0%) |
90.00 |
86.90 - 90.00 |
0.3175 times |
Mon 13 October 2025 |
90.00 (-0.61%) |
90.00 |
89.55 - 90.00 |
0.0304 times |
Fri 10 October 2025 |
90.55 (-3.83%) |
92.28 |
87.20 - 92.28 |
0.1235 times |
Thu 09 October 2025 |
94.16 (0.86%) |
93.36 |
90.65 - 94.30 |
0.5507 times |
Wed 08 October 2025 |
93.36 (-0.18%) |
104.99 |
91.60 - 104.99 |
3.9692 times |
Tue 07 October 2025 |
93.53 (7.92%) |
88.40 |
83.00 - 97.00 |
23.4137 times |
Weekly price and charts AmcoIndia Strong weekly Stock price targets for AmcoIndia 530133 are 86.32 and 94.12 | Weekly Target 1 | 84.68 | | Weekly Target 2 | 87.96 | | Weekly Target 3 | 92.48 | | Weekly Target 4 | 95.76 | | Weekly Target 5 | 100.28 |
Weekly price and volumes for Amco India
| Date |
Closing |
Open |
Range |
Volume |
Tue 21 October 2025 |
91.24 (-0.69%) |
97.00 |
89.20 - 97.00 |
0.3952 times |
Fri 17 October 2025 |
91.87 (1.46%) |
90.00 |
85.05 - 95.30 |
0.5797 times |
Fri 10 October 2025 |
90.55 (17.69%) |
76.94 |
73.62 - 104.99 |
6.6445 times |
Fri 03 October 2025 |
76.94 (-3.81%) |
79.99 |
75.60 - 79.99 |
0.0617 times |
Fri 26 September 2025 |
79.99 (1.29%) |
78.94 |
75.04 - 79.99 |
0.2702 times |
Thu 18 September 2025 |
78.97 (2.56%) |
76.75 |
73.42 - 79.99 |
0.2343 times |
Fri 12 September 2025 |
77.00 (-0.38%) |
79.35 |
74.15 - 80.99 |
0.4342 times |
Fri 05 September 2025 |
77.29 (-5.04%) |
77.33 |
72.50 - 82.99 |
0.6669 times |
Thu 28 August 2025 |
81.39 (1.78%) |
80.00 |
76.00 - 81.99 |
0.2238 times |
Fri 22 August 2025 |
79.97 (-1.22%) |
82.58 |
74.30 - 82.90 |
0.4895 times |
Thu 14 August 2025 |
80.96 (-2.67%) |
85.00 |
78.25 - 85.00 |
0.321 times |

Monthly price and charts AmcoIndia Strong monthly Stock price targets for AmcoIndia 530133 are 82.43 and 113.8 | Monthly Target 1 | 58.58 | | Monthly Target 2 | 74.91 | | Monthly Target 3 | 89.95 | | Monthly Target 4 | 106.28 | | Monthly Target 5 | 121.32 |
Monthly price and volumes Amco India
| Date |
Closing |
Open |
Range |
Volume |
Tue 21 October 2025 |
91.24 (18.37%) |
77.25 |
73.62 - 104.99 |
1.3089 times |
Tue 30 September 2025 |
77.08 (-5.3%) |
77.33 |
72.50 - 82.99 |
0.2796 times |
Thu 28 August 2025 |
81.39 (-11.53%) |
91.95 |
74.30 - 91.95 |
0.4982 times |
Thu 31 July 2025 |
92.00 (-8.31%) |
99.35 |
83.35 - 105.00 |
1.2017 times |
Mon 30 June 2025 |
100.34 (34.11%) |
70.02 |
68.20 - 107.00 |
3.1961 times |
Fri 30 May 2025 |
74.82 (1.87%) |
73.00 |
62.22 - 78.75 |
0.9288 times |
Wed 30 April 2025 |
73.45 (16%) |
63.32 |
63.32 - 85.00 |
0.7816 times |
Fri 28 March 2025 |
63.32 (-19.64%) |
78.00 |
62.50 - 82.00 |
0.6688 times |
Thu 27 February 2025 |
78.80 (2.34%) |
72.10 |
68.00 - 86.00 |
0.5932 times |
Fri 31 January 2025 |
77.00 (-10.27%) |
88.00 |
69.26 - 88.00 |
0.5431 times |
Tue 31 December 2024 |
85.81 (7.26%) |
79.10 |
79.10 - 98.80 |
0.6639 times |

DMA SMA EMA moving averages of Amco India 530133
DMA (daily moving average) of Amco India 530133
| DMA period | DMA value | | 5 day DMA | 90.22 | | 12 day DMA | 90.78 | | 20 day DMA | 85.91 | | 35 day DMA | 82.42 | | 50 day DMA | 82.15 | | 100 day DMA | 83.86 | | 150 day DMA | 79.86 | | 200 day DMA | 79.53 | EMA (exponential moving average) of Amco India 530133
| EMA period | EMA current | EMA prev | EMA prev2 | | 5 day EMA | 91.25 | 91.26 | 89.39 | | 12 day EMA | 89.2 | 88.83 | 87.71 | | 20 day EMA | 87.16 | 86.73 | 85.86 | | 35 day EMA | 85.38 | 85.03 | 84.44 | | 50 day EMA | 83.48 | 83.16 | 82.68 |
SMA (simple moving average) of Amco India 530133
| SMA period | SMA current | SMA prev | SMA prev2 | | 5 day SMA | 90.22 | 89.97 | 88.98 | | 12 day SMA | 90.78 | 89.59 | 88.22 | | 20 day SMA | 85.91 | 85.26 | 84.46 | | 35 day SMA | 82.42 | 82.14 | 81.74 | | 50 day SMA | 82.15 | 81.99 | 81.81 | | 100 day SMA | 83.86 | 83.63 | 83.38 | | 150 day SMA | 79.86 | 79.78 | 79.65 | | 200 day SMA | 79.53 | 79.53 | 79.5 |
|
|
