Cslfinance 530067 full analysis,charts,indicators,moving averages,SMA,DMA,EMA,ADX,MACD,RSICslfinance 530067 WideScreen charts, DMA,SMA,EMA technical analysis, forecast prediction, by indicators ADX,MACD,RSI,CCI BSE stock exchange
Daily price and charts and targets Cslfinance Strong Daily Stock price targets for Cslfinance 530067 are 268.25 and 278.6 | Daily Target 1 | 265.57 | | Daily Target 2 | 270.93 | | Daily Target 3 | 275.91666666667 | | Daily Target 4 | 281.28 | | Daily Target 5 | 286.27 |
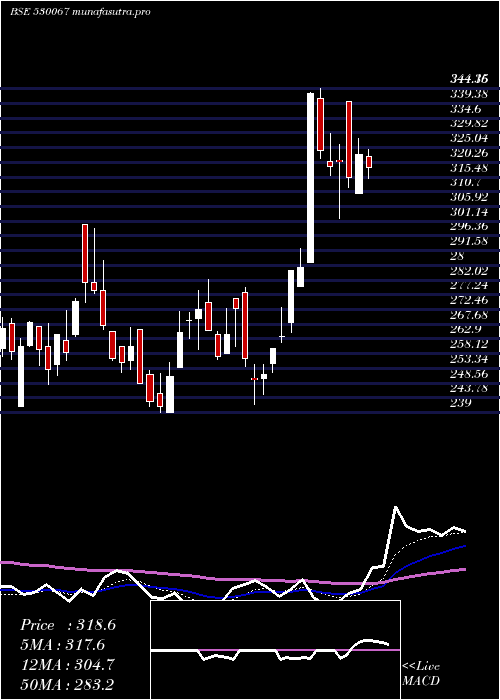
Daily price and volume Cslfinance
| Date |
Closing |
Open |
Range |
Volume |
Tue 21 October 2025 |
276.30 (-3.21%) |
278.70 |
270.55 - 280.90 |
0.0555 times |
Mon 20 October 2025 |
285.45 (5.55%) |
272.50 |
268.20 - 286.85 |
0.2383 times |
Fri 17 October 2025 |
270.45 (-1.3%) |
276.50 |
267.30 - 278.10 |
1.4298 times |
Thu 16 October 2025 |
274.00 (0.2%) |
276.90 |
273.50 - 280.20 |
0.3471 times |
Wed 15 October 2025 |
273.45 (-2.27%) |
282.65 |
269.95 - 282.65 |
1.2493 times |
Tue 14 October 2025 |
279.80 (-0.12%) |
283.40 |
279.75 - 283.55 |
0.0666 times |
Mon 13 October 2025 |
280.15 (-3.73%) |
283.75 |
280.05 - 288.25 |
2.4519 times |
Fri 10 October 2025 |
291.00 (3.03%) |
283.15 |
281.20 - 291.45 |
0.6283 times |
Thu 09 October 2025 |
282.45 (-0.53%) |
283.00 |
281.25 - 290.65 |
3.414 times |
Wed 08 October 2025 |
283.95 (-0.14%) |
287.35 |
281.95 - 287.35 |
0.1192 times |
Tue 07 October 2025 |
284.35 (-0.12%) |
287.05 |
284.35 - 288.05 |
1.4158 times |
Weekly price and charts Cslfinance Strong weekly Stock price targets for Cslfinance 530067 are 272.25 and 290.9 | Weekly Target 1 | 258.47 | | Weekly Target 2 | 267.38 | | Weekly Target 3 | 277.11666666667 | | Weekly Target 4 | 286.03 | | Weekly Target 5 | 295.77 |
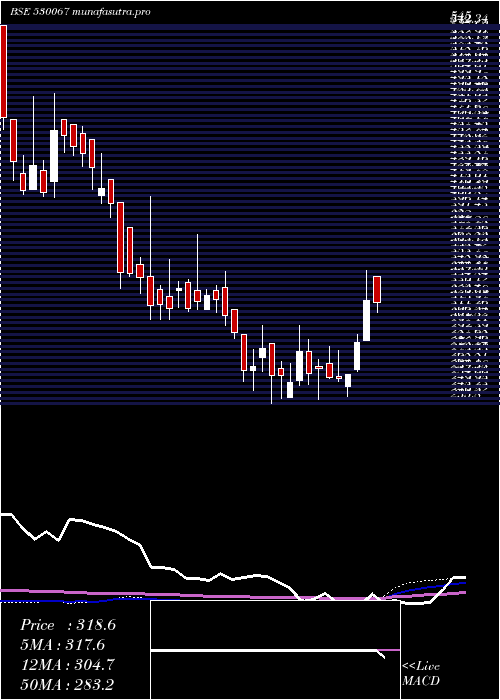
Weekly price and volumes for Cslfinance
| Date |
Closing |
Open |
Range |
Volume |
Tue 21 October 2025 |
276.30 (2.16%) |
272.50 |
268.20 - 286.85 |
0.0651 times |
Fri 17 October 2025 |
270.45 (-7.06%) |
283.75 |
267.30 - 288.25 |
1.2293 times |
Fri 10 October 2025 |
291.00 (1.06%) |
289.30 |
281.20 - 291.45 |
1.7064 times |
Fri 03 October 2025 |
287.95 (2.95%) |
282.75 |
276.60 - 296.20 |
0.5101 times |
Fri 26 September 2025 |
279.70 (-6.77%) |
302.60 |
275.85 - 302.70 |
0.8299 times |
Fri 19 September 2025 |
300.00 (2.21%) |
293.70 |
290.15 - 305.55 |
1.1879 times |
Fri 12 September 2025 |
293.50 (0.12%) |
294.05 |
288.30 - 303.15 |
1.4457 times |
Fri 05 September 2025 |
293.15 (-2.43%) |
302.95 |
287.15 - 302.95 |
2.1868 times |
Fri 29 August 2025 |
300.45 (-2.91%) |
304.80 |
285.65 - 313.00 |
0.4637 times |
Fri 22 August 2025 |
309.45 (1.83%) |
308.90 |
302.60 - 312.30 |
0.3751 times |
Thu 14 August 2025 |
303.90 (3.26%) |
294.00 |
292.95 - 322.15 |
0.2376 times |
Monthly price and charts Cslfinance Strong monthly Stock price targets for Cslfinance 530067 are 257.35 and 286.25 | Monthly Target 1 | 251.03 | | Monthly Target 2 | 263.67 | | Monthly Target 3 | 279.93333333333 | | Monthly Target 4 | 292.57 | | Monthly Target 5 | 308.83 |
Monthly price and volumes Cslfinance
| Date |
Closing |
Open |
Range |
Volume |
Tue 21 October 2025 |
276.30 (-2.61%) |
287.95 |
267.30 - 296.20 |
0.2768 times |
Tue 30 September 2025 |
283.70 (-5.57%) |
302.95 |
275.85 - 305.55 |
0.4508 times |
Fri 29 August 2025 |
300.45 (-1.81%) |
307.25 |
256.00 - 322.15 |
0.193 times |
Thu 31 July 2025 |
306.00 (-8.4%) |
337.00 |
295.30 - 348.65 |
0.3881 times |
Mon 30 June 2025 |
334.05 (4.6%) |
327.45 |
271.25 - 380.00 |
0.7128 times |
Fri 30 May 2025 |
319.35 (0.24%) |
318.60 |
276.00 - 331.40 |
0.4511 times |
Wed 30 April 2025 |
318.60 (23.85%) |
258.05 |
241.45 - 344.35 |
3.8473 times |
Fri 28 March 2025 |
257.25 (1.74%) |
254.75 |
239.00 - 300.00 |
2.3773 times |
Fri 28 February 2025 |
252.85 (-4.96%) |
273.45 |
235.80 - 300.00 |
0.6284 times |
Fri 31 January 2025 |
266.05 (-15.91%) |
324.00 |
246.90 - 343.95 |
0.6744 times |
Tue 31 December 2024 |
316.40 (1.01%) |
327.95 |
310.40 - 374.00 |
0.6572 times |

DMA SMA EMA moving averages of Cslfinance 530067
DMA (daily moving average) of Cslfinance 530067
| DMA period | DMA value | | 5 day DMA | 275.93 | | 12 day DMA | 280.5 | | 20 day DMA | 282.95 | | 35 day DMA | 288.22 | | 50 day DMA | 292.42 | | 100 day DMA | 309.02 | | 150 day DMA | 302.44 | | 200 day DMA | 297.34 | EMA (exponential moving average) of Cslfinance 530067
| EMA period | EMA current | EMA prev | EMA prev2 | | 5 day EMA | 277.91 | 278.72 | 275.36 | | 12 day EMA | 280.24 | 280.96 | 280.14 | | 20 day EMA | 283 | 283.7 | 283.52 | | 35 day EMA | 287.25 | 287.89 | 288.03 | | 50 day EMA | 291.57 | 292.19 | 292.46 |
SMA (simple moving average) of Cslfinance 530067
| SMA period | SMA current | SMA prev | SMA prev2 | | 5 day SMA | 275.93 | 276.63 | 275.57 | | 12 day SMA | 280.5 | 281.48 | 282.18 | | 20 day SMA | 282.95 | 283.79 | 284.52 | | 35 day SMA | 288.22 | 288.88 | 289.3 | | 50 day SMA | 292.42 | 292.9 | 293.19 | | 100 day SMA | 309.02 | 309.47 | 309.83 | | 150 day SMA | 302.44 | 302.43 | 302.25 | | 200 day SMA | 297.34 | 297.6 | 297.77 |
|
|
