Vivanza 530057 full analysis,charts,indicators,moving averages,SMA,DMA,EMA,ADX,MACD,RSIVivanza 530057 WideScreen charts, DMA,SMA,EMA technical analysis, forecast prediction, by indicators ADX,MACD,RSI,CCI BSE stock exchange
Daily price and charts and targets Vivanza Strong Daily Stock price targets for Vivanza 530057 are 2.02 and 2.08 | Daily Target 1 | 2.01 | | Daily Target 2 | 2.03 | | Daily Target 3 | 2.07 | | Daily Target 4 | 2.09 | | Daily Target 5 | 2.13 |
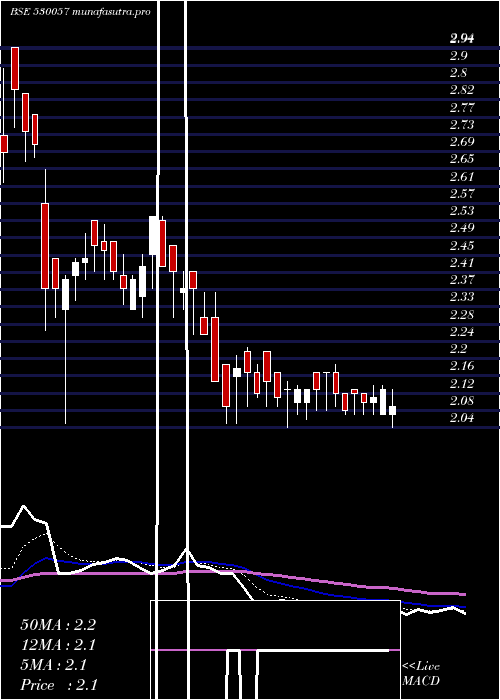
Daily price and volume Vivanza
| Date |
Closing |
Open |
Range |
Volume |
Thu 23 October 2025 |
2.05 (-3.76%) |
2.11 |
2.05 - 2.11 |
0.5138 times |
Tue 21 October 2025 |
2.13 (0.47%) |
2.13 |
2.13 - 2.13 |
0.0169 times |
Mon 20 October 2025 |
2.12 (6.53%) |
2.12 |
2.12 - 2.13 |
2.4106 times |
Fri 17 October 2025 |
1.99 (0.51%) |
1.99 |
1.98 - 1.99 |
1.3316 times |
Thu 16 October 2025 |
1.98 (-1%) |
1.96 |
1.96 - 2.09 |
0.6038 times |
Wed 15 October 2025 |
2.00 (0%) |
1.95 |
1.95 - 2.00 |
0.8299 times |
Tue 14 October 2025 |
2.00 (-3.38%) |
2.06 |
2.00 - 2.06 |
0.0548 times |
Mon 13 October 2025 |
2.07 (4.55%) |
1.98 |
1.98 - 2.08 |
0.2338 times |
Fri 10 October 2025 |
1.98 (-4.35%) |
2.05 |
1.98 - 2.05 |
1.5794 times |
Thu 09 October 2025 |
2.07 (0.49%) |
2.16 |
2.03 - 2.16 |
2.4255 times |
Wed 08 October 2025 |
2.06 (0%) |
2.25 |
2.05 - 2.25 |
1.6961 times |
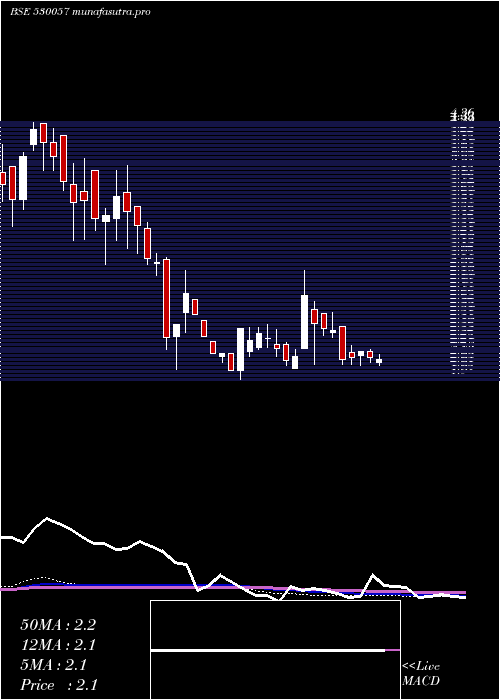
Weekly price and charts Vivanza Strong weekly Stock price targets for Vivanza 530057 are 2.01 and 2.09 | Weekly Target 1 | 2 | | Weekly Target 2 | 2.02 | | Weekly Target 3 | 2.0766666666667 | | Weekly Target 4 | 2.1 | | Weekly Target 5 | 2.16 |
Weekly price and volumes for Vivanza
| Date |
Closing |
Open |
Range |
Volume |
Thu 23 October 2025 |
2.05 (3.02%) |
2.12 |
2.05 - 2.13 |
0.3601 times |
Fri 17 October 2025 |
1.99 (0.51%) |
1.98 |
1.95 - 2.09 |
0.3739 times |
Fri 10 October 2025 |
1.98 (-3.88%) |
2.05 |
1.98 - 2.25 |
1.0638 times |
Fri 03 October 2025 |
2.06 (0.49%) |
2.04 |
2.00 - 2.10 |
0.8082 times |
Fri 26 September 2025 |
2.05 (0%) |
2.12 |
2.04 - 2.15 |
0.9052 times |
Fri 19 September 2025 |
2.05 (-0.97%) |
2.02 |
2.02 - 2.22 |
2.0158 times |
Fri 12 September 2025 |
2.07 (0.98%) |
2.09 |
1.98 - 2.14 |
1.6013 times |
Fri 05 September 2025 |
2.05 (0%) |
2.10 |
2.02 - 2.10 |
0.6951 times |
Fri 29 August 2025 |
2.05 (-2.38%) |
2.10 |
1.98 - 2.14 |
0.9021 times |
Fri 22 August 2025 |
2.10 (0%) |
2.10 |
2.04 - 2.18 |
1.2745 times |
Thu 14 August 2025 |
2.10 (0%) |
2.14 |
2.00 - 2.14 |
0.4147 times |
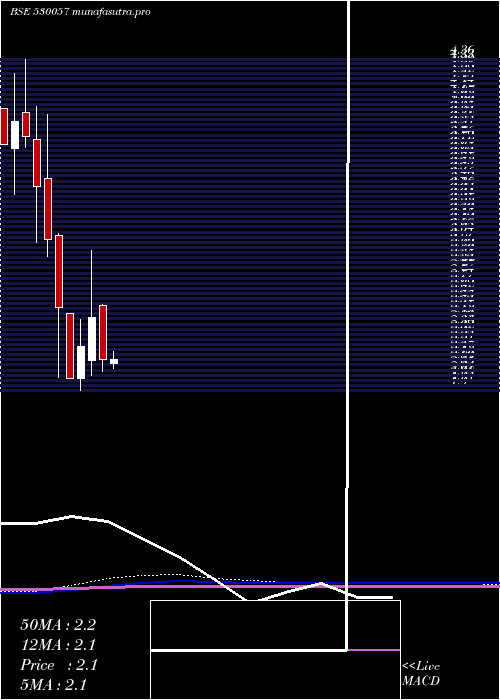
Monthly price and charts Vivanza Strong monthly Stock price targets for Vivanza 530057 are 2 and 2.3 | Monthly Target 1 | 1.78 | | Monthly Target 2 | 1.92 | | Monthly Target 3 | 2.0833333333333 | | Monthly Target 4 | 2.22 | | Monthly Target 5 | 2.38 |
Monthly price and volumes Vivanza
| Date |
Closing |
Open |
Range |
Volume |
Thu 23 October 2025 |
2.05 (0.49%) |
2.04 |
1.95 - 2.25 |
0.2329 times |
Tue 30 September 2025 |
2.04 (-0.49%) |
2.10 |
1.98 - 2.22 |
0.6577 times |
Fri 29 August 2025 |
2.05 (0.49%) |
2.08 |
1.98 - 2.18 |
0.3781 times |
Thu 31 July 2025 |
2.04 (-4.23%) |
2.10 |
2.02 - 2.20 |
0.4143 times |
Mon 30 June 2025 |
2.13 (-12.7%) |
2.53 |
2.04 - 2.54 |
0.9244 times |
Fri 30 May 2025 |
2.44 (9.42%) |
2.12 |
2.01 - 2.94 |
1.1229 times |
Wed 30 April 2025 |
2.23 (12.06%) |
1.99 |
1.90 - 2.43 |
0.4098 times |
Fri 28 March 2025 |
1.99 (-21.03%) |
2.47 |
1.99 - 2.47 |
0.3892 times |
Fri 28 February 2025 |
2.52 (-16.56%) |
3.05 |
2.00 - 3.07 |
1.2281 times |
Fri 31 January 2025 |
3.02 (-11.7%) |
3.48 |
2.90 - 3.95 |
4.2425 times |
Tue 31 December 2024 |
3.42 (-9.76%) |
3.77 |
3.00 - 4.01 |
5.5492 times |
DMA SMA EMA moving averages of Vivanza 530057
DMA (daily moving average) of Vivanza 530057
| DMA period | DMA value | | 5 day DMA | 2.05 | | 12 day DMA | 2.04 | | 20 day DMA | 2.05 | | 35 day DMA | 2.06 | | 50 day DMA | 2.07 | | 100 day DMA | 2.12 | | 150 day DMA | 2.17 | | 200 day DMA | 2.37 | EMA (exponential moving average) of Vivanza 530057
| EMA period | EMA current | EMA prev | EMA prev2 | | 5 day EMA | 2.06 | 2.07 | 2.04 | | 12 day EMA | 2.05 | 2.05 | 2.04 | | 20 day EMA | 2.06 | 2.06 | 2.05 | | 35 day EMA | 2.06 | 2.06 | 2.06 | | 50 day EMA | 2.07 | 2.07 | 2.07 |
SMA (simple moving average) of Vivanza 530057
| SMA period | SMA current | SMA prev | SMA prev2 | | 5 day SMA | 2.05 | 2.04 | 2.02 | | 12 day SMA | 2.04 | 2.04 | 2.04 | | 20 day SMA | 2.05 | 2.05 | 2.05 | | 35 day SMA | 2.06 | 2.06 | 2.06 | | 50 day SMA | 2.07 | 2.07 | 2.06 | | 100 day SMA | 2.12 | 2.13 | 2.13 | | 150 day SMA | 2.17 | 2.17 | 2.17 | | 200 day SMA | 2.37 | 2.37 | 2.38 |
|
|
