Theinvest 530023 full analysis,charts,indicators,moving averages,SMA,DMA,EMA,ADX,MACD,RSITheinvest 530023 WideScreen charts, DMA,SMA,EMA technical analysis, forecast prediction, by indicators ADX,MACD,RSI,CCI BSE stock exchange
Daily price and charts and targets Theinvest Strong Daily Stock price targets for Theinvest 530023 are 145.55 and 149.45 | Daily Target 1 | 142.3 | | Daily Target 2 | 144.9 | | Daily Target 3 | 146.2 | | Daily Target 4 | 148.8 | | Daily Target 5 | 150.1 |
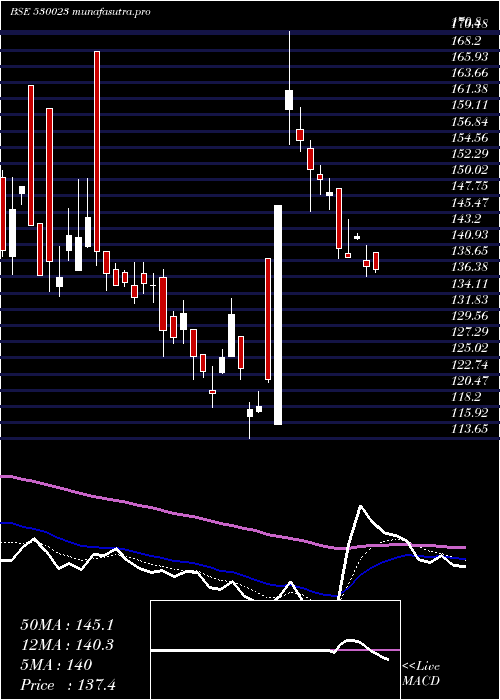
Daily price and volume Theinvest
| Date |
Closing |
Open |
Range |
Volume |
Tue 21 October 2025 |
147.50 (2.47%) |
143.60 |
143.60 - 147.50 |
0.2409 times |
Mon 20 October 2025 |
143.95 (3.01%) |
140.70 |
139.90 - 149.20 |
0.4697 times |
Fri 17 October 2025 |
139.75 (-0.96%) |
141.10 |
139.10 - 141.10 |
0.4396 times |
Thu 16 October 2025 |
141.10 (-0.18%) |
141.00 |
138.10 - 144.10 |
1.0924 times |
Wed 15 October 2025 |
141.35 (2.02%) |
141.00 |
133.10 - 142.50 |
1.1538 times |
Tue 14 October 2025 |
138.55 (-2.12%) |
144.50 |
138.55 - 144.50 |
0.4179 times |
Mon 13 October 2025 |
141.55 (-3.64%) |
146.95 |
141.55 - 146.95 |
0.1289 times |
Fri 10 October 2025 |
146.90 (1.87%) |
154.00 |
146.90 - 154.00 |
0.1216 times |
Thu 09 October 2025 |
144.20 (-1.4%) |
147.00 |
143.50 - 149.60 |
2.0053 times |
Wed 08 October 2025 |
146.25 (-1.85%) |
148.40 |
146.25 - 152.30 |
3.9299 times |
Tue 07 October 2025 |
149.00 (0%) |
149.00 |
145.65 - 149.10 |
0.0855 times |
Weekly price and charts Theinvest Strong weekly Stock price targets for Theinvest 530023 are 143.7 and 153 | Weekly Target 1 | 136.23 | | Weekly Target 2 | 141.87 | | Weekly Target 3 | 145.53333333333 | | Weekly Target 4 | 151.17 | | Weekly Target 5 | 154.83 |
Weekly price and volumes for Theinvest
| Date |
Closing |
Open |
Range |
Volume |
Tue 21 October 2025 |
147.50 (5.55%) |
140.70 |
139.90 - 149.20 |
0.0131 times |
Fri 17 October 2025 |
139.75 (-4.87%) |
146.95 |
133.10 - 146.95 |
0.0598 times |
Fri 10 October 2025 |
146.90 (1.84%) |
147.00 |
143.50 - 154.00 |
0.1372 times |
Fri 03 October 2025 |
144.25 (-0.21%) |
143.10 |
139.95 - 150.15 |
0.1377 times |
Fri 26 September 2025 |
144.55 (-6.41%) |
155.55 |
143.75 - 158.80 |
0.1378 times |
Fri 19 September 2025 |
154.45 (1.81%) |
152.00 |
146.00 - 158.60 |
4.1308 times |
Fri 12 September 2025 |
151.70 (-1.56%) |
154.50 |
148.00 - 159.00 |
0.3151 times |
Fri 05 September 2025 |
154.10 (0.78%) |
151.75 |
150.85 - 156.00 |
0.0746 times |
Fri 29 August 2025 |
152.90 (-1.92%) |
157.30 |
150.00 - 158.90 |
0.338 times |
Fri 22 August 2025 |
155.90 (-0.8%) |
172.00 |
153.00 - 172.00 |
4.6557 times |
Thu 14 August 2025 |
157.15 (-0.13%) |
154.70 |
150.30 - 164.70 |
0.3801 times |

Monthly price and charts Theinvest Strong monthly Stock price targets for Theinvest 530023 are 140.3 and 161.2 | Monthly Target 1 | 123.97 | | Monthly Target 2 | 135.73 | | Monthly Target 3 | 144.86666666667 | | Monthly Target 4 | 156.63 | | Monthly Target 5 | 165.77 |
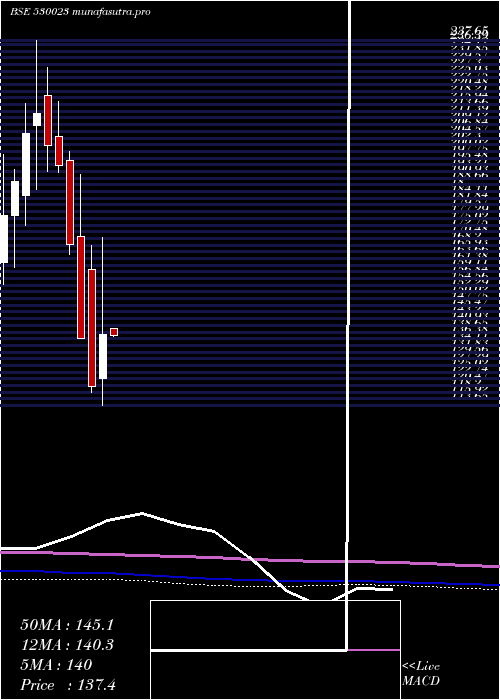
Monthly price and volumes Theinvest
| Date |
Closing |
Open |
Range |
Volume |
Tue 21 October 2025 |
147.50 (2.01%) |
145.70 |
133.10 - 154.00 |
0.1353 times |
Tue 30 September 2025 |
144.60 (-5.43%) |
151.75 |
139.95 - 159.00 |
1.8996 times |
Fri 29 August 2025 |
152.90 (-5.27%) |
164.40 |
149.10 - 177.95 |
2.2651 times |
Thu 31 July 2025 |
161.40 (4.5%) |
153.45 |
137.00 - 184.00 |
1.4115 times |
Mon 30 June 2025 |
154.45 (7.71%) |
144.50 |
141.55 - 163.40 |
0.488 times |
Fri 30 May 2025 |
143.40 (4.03%) |
139.75 |
137.00 - 163.50 |
0.9035 times |
Wed 30 April 2025 |
137.85 (14.88%) |
123.00 |
113.65 - 170.80 |
1.0878 times |
Fri 28 March 2025 |
120.00 (-12.09%) |
160.00 |
118.00 - 168.00 |
0.762 times |
Fri 28 February 2025 |
136.50 (-18.87%) |
171.00 |
136.50 - 192.30 |
0.466 times |
Fri 31 January 2025 |
168.25 (-13.83%) |
197.00 |
164.95 - 200.05 |
0.5812 times |
Tue 31 December 2024 |
195.25 (-3.34%) |
204.95 |
193.00 - 217.00 |
0.4354 times |
DMA SMA EMA moving averages of Theinvest 530023
DMA (daily moving average) of Theinvest 530023
| DMA period | DMA value | | 5 day DMA | 142.73 | | 12 day DMA | 144.09 | | 20 day DMA | 145.65 | | 35 day DMA | 148.25 | | 50 day DMA | 150.44 | | 100 day DMA | 152.39 | | 150 day DMA | 148.39 | | 200 day DMA | 153.74 | EMA (exponential moving average) of Theinvest 530023
| EMA period | EMA current | EMA prev | EMA prev2 | | 5 day EMA | 143.89 | 142.09 | 141.16 | | 12 day EMA | 144.09 | 143.47 | 143.38 | | 20 day EMA | 145.42 | 145.2 | 145.33 | | 35 day EMA | 147.89 | 147.91 | 148.14 | | 50 day EMA | 150.47 | 150.59 | 150.86 |
SMA (simple moving average) of Theinvest 530023
| SMA period | SMA current | SMA prev | SMA prev2 | | 5 day SMA | 142.73 | 140.94 | 140.46 | | 12 day SMA | 144.09 | 143.82 | 143.8 | | 20 day SMA | 145.65 | 145.85 | 146.37 | | 35 day SMA | 148.25 | 148.43 | 148.69 | | 50 day SMA | 150.44 | 150.67 | 150.89 | | 100 day SMA | 152.39 | 152.38 | 152.4 | | 150 day SMA | 148.39 | 148.35 | 148.3 | | 200 day SMA | 153.74 | 154 | 154.31 |
|
|
