Jubilant 530019 full analysis,charts,indicators,moving averages,SMA,DMA,EMA,ADX,MACD,RSIJubilant 530019 WideScreen charts, DMA,SMA,EMA technical analysis, forecast prediction, by indicators ADX,MACD,RSI,CCI BSE stock exchange
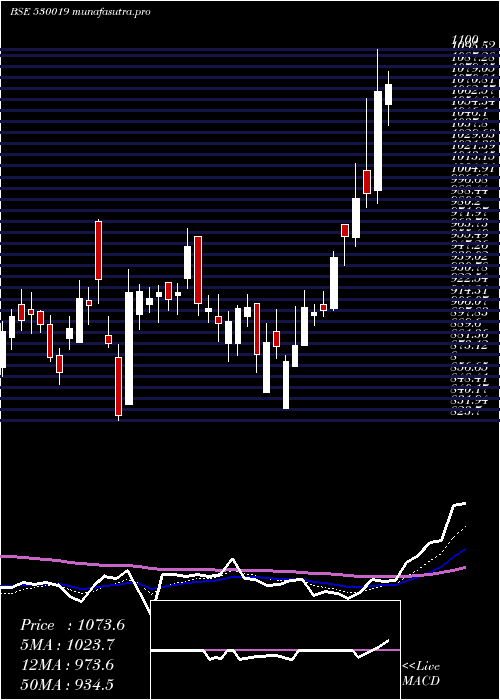
Daily price and charts and targets Jubilant Strong Daily Stock price targets for Jubilant 530019 are 1098.63 and 1143.18 | Daily Target 1 | 1089.32 | | Daily Target 2 | 1107.93 | | Daily Target 3 | 1133.8666666667 | | Daily Target 4 | 1152.48 | | Daily Target 5 | 1178.42 |
Daily price and volume Jubilant
| Date |
Closing |
Open |
Range |
Volume |
Thu 23 October 2025 |
1126.55 (-1.57%) |
1159.80 |
1115.25 - 1159.80 |
2.0181 times |
Tue 21 October 2025 |
1144.50 (4.07%) |
1106.25 |
1102.35 - 1182.85 |
3.5808 times |
Mon 20 October 2025 |
1099.70 (1.93%) |
1078.90 |
1072.70 - 1101.65 |
0.5097 times |
Fri 17 October 2025 |
1078.90 (0.62%) |
1073.10 |
1065.00 - 1081.95 |
0.3367 times |
Thu 16 October 2025 |
1072.30 (-0.26%) |
1075.15 |
1066.50 - 1086.80 |
0.2271 times |
Wed 15 October 2025 |
1075.10 (-0.27%) |
1074.65 |
1033.75 - 1089.00 |
1.0899 times |
Tue 14 October 2025 |
1078.00 (-1.73%) |
1098.00 |
1065.00 - 1098.25 |
0.616 times |
Mon 13 October 2025 |
1096.95 (-2.04%) |
1125.05 |
1094.75 - 1125.10 |
0.2552 times |
Fri 10 October 2025 |
1119.85 (2.2%) |
1099.15 |
1093.00 - 1136.90 |
0.7947 times |
Thu 09 October 2025 |
1095.70 (0.87%) |
1082.05 |
1082.05 - 1105.65 |
0.5718 times |
Wed 08 October 2025 |
1086.25 (-1.03%) |
1100.00 |
1081.00 - 1105.00 |
0.3361 times |
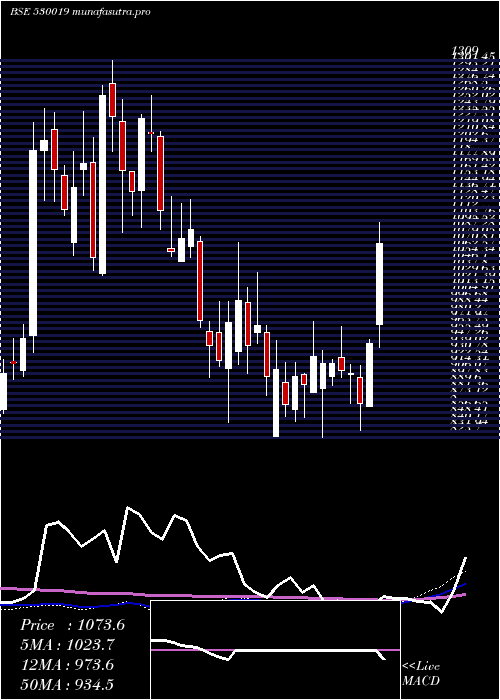
Weekly price and charts Jubilant Strong weekly Stock price targets for Jubilant 530019 are 1099.63 and 1209.78 | Weekly Target 1 | 1017.22 | | Weekly Target 2 | 1071.88 | | Weekly Target 3 | 1127.3666666667 | | Weekly Target 4 | 1182.03 | | Weekly Target 5 | 1237.52 |
Weekly price and volumes for Jubilant
| Date |
Closing |
Open |
Range |
Volume |
Thu 23 October 2025 |
1126.55 (4.42%) |
1078.90 |
1072.70 - 1182.85 |
1.3258 times |
Fri 17 October 2025 |
1078.90 (-3.66%) |
1125.05 |
1033.75 - 1125.10 |
0.548 times |
Fri 10 October 2025 |
1119.85 (-0.01%) |
1120.00 |
1081.00 - 1136.90 |
0.7667 times |
Fri 03 October 2025 |
1120.00 (7.26%) |
1094.90 |
1046.95 - 1135.80 |
1.1118 times |
Fri 26 September 2025 |
1044.20 (-5.37%) |
1128.00 |
1016.10 - 1128.05 |
1.2276 times |
Fri 19 September 2025 |
1103.45 (-1.71%) |
1107.05 |
1084.05 - 1147.40 |
0.6909 times |
Fri 12 September 2025 |
1122.70 (4.95%) |
1069.70 |
1069.70 - 1148.00 |
1.6174 times |
Fri 05 September 2025 |
1069.70 (4.93%) |
1069.35 |
1017.65 - 1076.45 |
0.7912 times |
Fri 29 August 2025 |
1019.45 (-5.71%) |
1083.15 |
1012.75 - 1088.95 |
0.8188 times |
Fri 22 August 2025 |
1081.20 (2.4%) |
1119.25 |
1025.00 - 1119.25 |
1.1019 times |
Thu 14 August 2025 |
1055.85 (-4.18%) |
1109.95 |
1049.00 - 1109.95 |
0.9002 times |
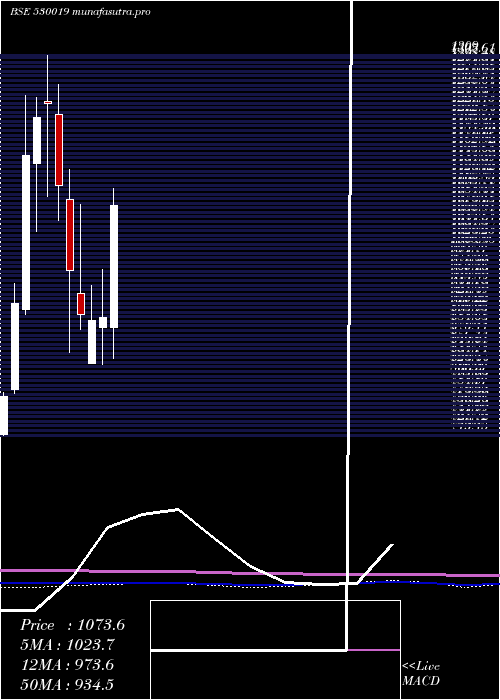
Monthly price and charts Jubilant Strong monthly Stock price targets for Jubilant 530019 are 1080.15 and 1229.25 | Monthly Target 1 | 965.28 | | Monthly Target 2 | 1045.92 | | Monthly Target 3 | 1114.3833333333 | | Monthly Target 4 | 1195.02 | | Monthly Target 5 | 1263.48 |
Monthly price and volumes Jubilant
| Date |
Closing |
Open |
Range |
Volume |
Thu 23 October 2025 |
1126.55 (4.45%) |
1078.45 |
1033.75 - 1182.85 |
0.4375 times |
Tue 30 September 2025 |
1078.55 (5.8%) |
1069.35 |
1016.10 - 1148.00 |
0.7431 times |
Fri 29 August 2025 |
1019.45 (-14.55%) |
1180.15 |
1012.75 - 1181.90 |
0.699 times |
Thu 31 July 2025 |
1193.10 (-1.33%) |
1209.20 |
1096.15 - 1250.00 |
1.3584 times |
Mon 30 June 2025 |
1209.20 (3.14%) |
1179.45 |
1060.50 - 1221.00 |
1.3845 times |
Fri 30 May 2025 |
1172.35 (30.65%) |
881.65 |
832.95 - 1175.90 |
1.4987 times |
Wed 30 April 2025 |
897.30 (0.52%) |
881.75 |
823.70 - 973.70 |
0.7664 times |
Fri 28 March 2025 |
892.70 (-1.08%) |
825.30 |
825.30 - 948.50 |
0.8196 times |
Fri 28 February 2025 |
902.45 (-7.21%) |
935.05 |
878.45 - 1075.00 |
1.2571 times |
Fri 31 January 2025 |
972.55 (-11.95%) |
1083.10 |
843.65 - 1129.95 |
1.0357 times |
Tue 31 December 2024 |
1104.60 (-10.48%) |
1216.05 |
1050.00 - 1263.90 |
3.4358 times |
DMA SMA EMA moving averages of Jubilant 530019
DMA (daily moving average) of Jubilant 530019
| DMA period | DMA value | | 5 day DMA | 1104.39 | | 12 day DMA | 1097.62 | | 20 day DMA | 1091.84 | | 35 day DMA | 1096.31 | | 50 day DMA | 1086.13 | | 100 day DMA | 1125.46 | | 150 day DMA | 1059.67 | | 200 day DMA | 1039.29 | EMA (exponential moving average) of Jubilant 530019
| EMA period | EMA current | EMA prev | EMA prev2 | | 5 day EMA | 1113.1 | 1106.38 | 1087.33 | | 12 day EMA | 1101.84 | 1097.35 | 1088.78 | | 20 day EMA | 1098.06 | 1095.06 | 1089.86 | | 35 day EMA | 1092.83 | 1090.85 | 1087.69 | | 50 day EMA | 1090.64 | 1089.17 | 1086.91 |
SMA (simple moving average) of Jubilant 530019
| SMA period | SMA current | SMA prev | SMA prev2 | | 5 day SMA | 1104.39 | 1094.1 | 1080.8 | | 12 day SMA | 1097.62 | 1095.38 | 1093.34 | | 20 day SMA | 1091.84 | 1089.71 | 1087.09 | | 35 day SMA | 1096.31 | 1093.81 | 1090.81 | | 50 day SMA | 1086.13 | 1085.64 | 1084.9 | | 100 day SMA | 1125.46 | 1125.75 | 1125.62 | | 150 day SMA | 1059.67 | 1058.28 | 1056.63 | | 200 day SMA | 1039.29 | 1039.14 | 1038.74 |
|
|
