ManglrChem 530011 full analysis,charts,indicators,moving averages,SMA,DMA,EMA,ADX,MACD,RSIManglr Chem 530011 WideScreen charts, DMA,SMA,EMA technical analysis, forecast prediction, by indicators ADX,MACD,RSI,CCI BSE stock exchange
Daily price and charts and targets ManglrChem Strong Daily Stock price targets for ManglrChem 530011 are 316.93 and 323.33 | Daily Target 1 | 315.35 | | Daily Target 2 | 318.5 | | Daily Target 3 | 321.75 | | Daily Target 4 | 324.9 | | Daily Target 5 | 328.15 |
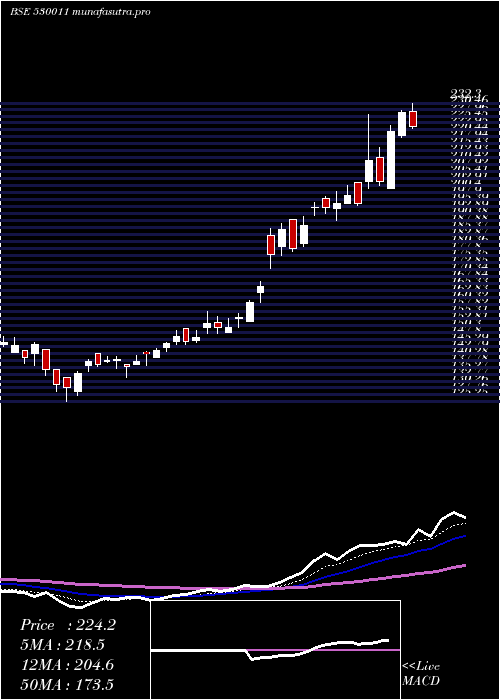
Daily price and volume Manglr Chem
| Date |
Closing |
Open |
Range |
Volume |
Tue 21 October 2025 |
321.65 (-0.03%) |
325.00 |
318.60 - 325.00 |
0.0692 times |
Mon 20 October 2025 |
321.75 (1.08%) |
318.60 |
315.15 - 322.45 |
0.2538 times |
Fri 17 October 2025 |
318.30 (-0.81%) |
321.50 |
314.50 - 321.90 |
0.2214 times |
Thu 16 October 2025 |
320.90 (0.28%) |
316.95 |
316.80 - 323.35 |
0.2568 times |
Wed 15 October 2025 |
320.00 (2.35%) |
309.10 |
307.35 - 320.60 |
2.9756 times |
Tue 14 October 2025 |
312.65 (-2.89%) |
322.00 |
310.00 - 322.65 |
0.3882 times |
Mon 13 October 2025 |
321.95 (1.26%) |
316.10 |
314.25 - 323.95 |
0.199 times |
Fri 10 October 2025 |
317.95 (0.02%) |
317.15 |
314.55 - 321.70 |
0.3783 times |
Thu 09 October 2025 |
317.90 (-4.93%) |
331.75 |
310.00 - 333.00 |
2.3407 times |
Wed 08 October 2025 |
334.40 (1.7%) |
323.00 |
323.00 - 338.00 |
2.917 times |
Tue 07 October 2025 |
328.80 (-1.42%) |
333.55 |
328.05 - 338.60 |
0.451 times |
Weekly price and charts ManglrChem Strong weekly Stock price targets for ManglrChem 530011 are 318.4 and 328.25 | Weekly Target 1 | 310.75 | | Weekly Target 2 | 316.2 | | Weekly Target 3 | 320.6 | | Weekly Target 4 | 326.05 | | Weekly Target 5 | 330.45 |
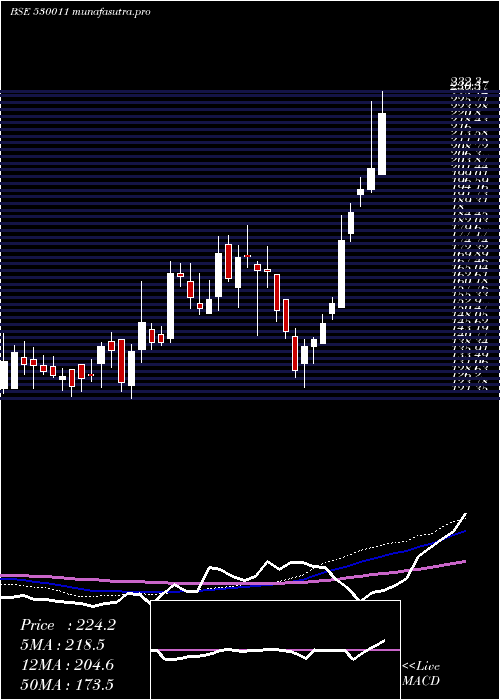
Weekly price and volumes for Manglr Chem
| Date |
Closing |
Open |
Range |
Volume |
Tue 21 October 2025 |
321.65 (1.05%) |
318.60 |
315.15 - 325.00 |
0.0846 times |
Fri 17 October 2025 |
318.30 (0.11%) |
316.10 |
307.35 - 323.95 |
1.0582 times |
Fri 10 October 2025 |
317.95 (-4.2%) |
330.60 |
310.00 - 338.60 |
1.8151 times |
Fri 03 October 2025 |
331.90 (5.33%) |
319.90 |
306.50 - 341.50 |
1.0956 times |
Fri 26 September 2025 |
315.10 (3.06%) |
305.65 |
305.65 - 338.90 |
0.9307 times |
Fri 19 September 2025 |
305.75 (-0.11%) |
302.15 |
302.15 - 313.50 |
0.7621 times |
Fri 12 September 2025 |
306.10 (-9.53%) |
334.90 |
301.40 - 338.80 |
1.4984 times |
Fri 05 September 2025 |
338.35 (-1.97%) |
357.90 |
333.35 - 359.95 |
0.8738 times |
Fri 29 August 2025 |
345.15 (-2.43%) |
357.70 |
341.65 - 368.50 |
1.1435 times |
Fri 22 August 2025 |
353.75 (3.3%) |
343.60 |
342.40 - 363.55 |
0.738 times |
Thu 14 August 2025 |
342.45 (-3.9%) |
354.05 |
337.35 - 365.60 |
0.8707 times |
Monthly price and charts ManglrChem Strong monthly Stock price targets for ManglrChem 530011 are 298.88 and 330.13 | Monthly Target 1 | 291.28 | | Monthly Target 2 | 306.47 | | Monthly Target 3 | 322.53333333333 | | Monthly Target 4 | 337.72 | | Monthly Target 5 | 353.78 |
Monthly price and volumes Manglr Chem
| Date |
Closing |
Open |
Range |
Volume |
Tue 21 October 2025 |
321.65 (-0.8%) |
325.45 |
307.35 - 338.60 |
0.5052 times |
Tue 30 September 2025 |
324.25 (-6.06%) |
357.90 |
301.40 - 359.95 |
0.7778 times |
Fri 29 August 2025 |
345.15 (-2.42%) |
358.85 |
337.35 - 373.10 |
0.6861 times |
Thu 31 July 2025 |
353.70 (29.21%) |
268.05 |
251.60 - 367.55 |
1.4856 times |
Mon 30 June 2025 |
273.75 (3.63%) |
264.25 |
262.20 - 301.35 |
0.8072 times |
Fri 30 May 2025 |
264.15 (17.82%) |
228.45 |
208.80 - 269.15 |
1.4843 times |
Wed 30 April 2025 |
224.20 (43.95%) |
154.10 |
154.10 - 232.30 |
2.4417 times |
Fri 28 March 2025 |
155.75 (18.58%) |
133.90 |
125.25 - 157.85 |
0.3011 times |
Fri 28 February 2025 |
131.35 (-21.68%) |
167.95 |
129.05 - 176.25 |
0.4221 times |
Fri 31 January 2025 |
167.70 (9%) |
153.25 |
144.00 - 183.60 |
1.089 times |
Tue 31 December 2024 |
153.85 (-7.65%) |
166.45 |
151.80 - 170.00 |
0.7441 times |

DMA SMA EMA moving averages of Manglr Chem 530011
DMA (daily moving average) of Manglr Chem 530011
| DMA period | DMA value | | 5 day DMA | 320.52 | | 12 day DMA | 322.48 | | 20 day DMA | 323.24 | | 35 day DMA | 322.98 | | 50 day DMA | 331.76 | | 100 day DMA | 312.17 | | 150 day DMA | 274.25 | | 200 day DMA | 245.43 | EMA (exponential moving average) of Manglr Chem 530011
| EMA period | EMA current | EMA prev | EMA prev2 | | 5 day EMA | 320.72 | 320.26 | 319.51 | | 12 day EMA | 321.34 | 321.28 | 321.2 | | 20 day EMA | 322.55 | 322.65 | 322.75 | | 35 day EMA | 328.26 | 328.65 | 329.06 | | 50 day EMA | 332.79 | 333.24 | 333.71 |
SMA (simple moving average) of Manglr Chem 530011
| SMA period | SMA current | SMA prev | SMA prev2 | | 5 day SMA | 320.52 | 318.72 | 318.76 | | 12 day SMA | 322.48 | 323.34 | 323.8 | | 20 day SMA | 323.24 | 323.21 | 322.41 | | 35 day SMA | 322.98 | 324.02 | 324.69 | | 50 day SMA | 331.76 | 332.34 | 333.19 | | 100 day SMA | 312.17 | 311.61 | 311.01 | | 150 day SMA | 274.25 | 273.03 | 271.79 | | 200 day SMA | 245.43 | 244.6 | 243.76 |
|
|
