Shbajrg 526981 full analysis,charts,indicators,moving averages,SMA,DMA,EMA,ADX,MACD,RSIShbajrg 526981 WideScreen charts, DMA,SMA,EMA technical analysis, forecast prediction, by indicators ADX,MACD,RSI,CCI BSE stock exchange
Daily price and charts and targets Shbajrg Strong Daily Stock price targets for Shbajrg 526981 are 193.43 and 199.78 | Daily Target 1 | 192.13 | | Daily Target 2 | 194.72 | | Daily Target 3 | 198.48333333333 | | Daily Target 4 | 201.07 | | Daily Target 5 | 204.83 |
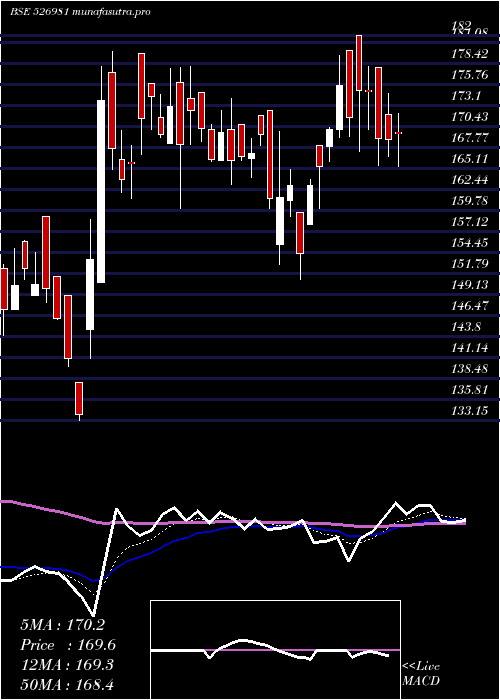
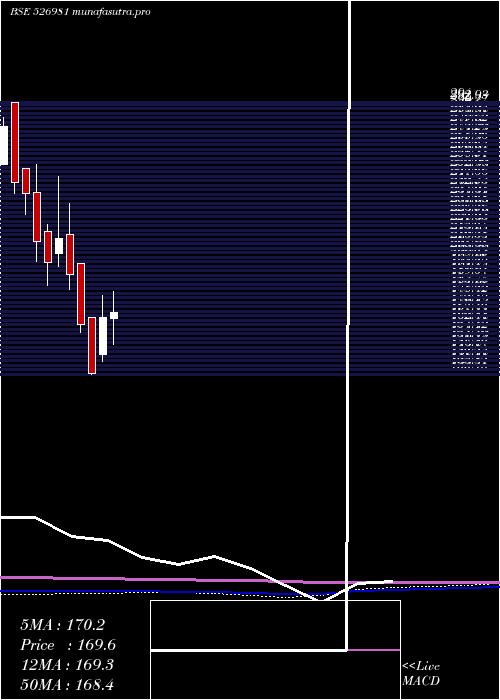
Daily price and volume Shbajrg
| Date |
Closing |
Open |
Range |
Volume |
Thu 23 October 2025 |
197.30 (-0.95%) |
202.25 |
195.90 - 202.25 |
0.317 times |
Tue 21 October 2025 |
199.20 (2.71%) |
194.00 |
194.00 - 200.00 |
1.3764 times |
Mon 20 October 2025 |
193.95 (2.54%) |
199.00 |
191.90 - 199.00 |
0.931 times |
Fri 17 October 2025 |
189.15 (-1.36%) |
198.00 |
188.05 - 198.00 |
1.5736 times |
Thu 16 October 2025 |
191.75 (-0.21%) |
197.35 |
191.40 - 197.35 |
2.0212 times |
Wed 15 October 2025 |
192.15 (-0.44%) |
198.80 |
191.35 - 198.80 |
0.8154 times |
Tue 14 October 2025 |
193.00 (-3.36%) |
195.30 |
190.30 - 198.50 |
0.626 times |
Mon 13 October 2025 |
199.70 (1.89%) |
199.95 |
198.00 - 201.00 |
0.5277 times |
Fri 10 October 2025 |
196.00 (2.06%) |
199.00 |
192.50 - 199.00 |
0.6247 times |
Thu 09 October 2025 |
192.05 (-1.74%) |
199.80 |
190.00 - 199.80 |
1.187 times |
Wed 08 October 2025 |
195.45 (-2.28%) |
200.00 |
193.55 - 202.00 |
2.7565 times |
Weekly price and charts Shbajrg Strong weekly Stock price targets for Shbajrg 526981 are 189.43 and 199.78 | Weekly Target 1 | 186.8 | | Weekly Target 2 | 192.05 | | Weekly Target 3 | 197.15 | | Weekly Target 4 | 202.4 | | Weekly Target 5 | 207.5 |
Weekly price and volumes for Shbajrg
| Date |
Closing |
Open |
Range |
Volume |
Thu 23 October 2025 |
197.30 (4.31%) |
199.00 |
191.90 - 202.25 |
0.4687 times |
Fri 17 October 2025 |
189.15 (-3.49%) |
199.95 |
188.05 - 201.00 |
0.9937 times |
Fri 10 October 2025 |
196.00 (-1.13%) |
204.00 |
190.00 - 204.00 |
0.9803 times |
Fri 03 October 2025 |
198.25 (2.64%) |
204.80 |
196.00 - 204.85 |
0.6041 times |
Fri 26 September 2025 |
193.15 (-1.58%) |
202.50 |
193.00 - 227.40 |
1.5613 times |
Fri 19 September 2025 |
196.25 (-3.06%) |
200.00 |
192.00 - 202.85 |
1.4932 times |
Fri 12 September 2025 |
202.45 (1.07%) |
203.00 |
195.00 - 207.75 |
1.2236 times |
Fri 05 September 2025 |
200.30 (0.15%) |
200.00 |
192.05 - 216.80 |
1.4993 times |
Fri 29 August 2025 |
200.00 (2.54%) |
198.95 |
192.20 - 206.45 |
0.4016 times |
Fri 22 August 2025 |
195.05 (-3.37%) |
206.00 |
194.00 - 206.00 |
0.7743 times |
Thu 14 August 2025 |
201.85 (1.92%) |
198.00 |
191.05 - 206.00 |
0.4471 times |

Monthly price and charts Shbajrg Strong monthly Stock price targets for Shbajrg 526981 are 184.28 and 201.08 | Monthly Target 1 | 179.93 | | Monthly Target 2 | 188.62 | | Monthly Target 3 | 196.73333333333 | | Monthly Target 4 | 205.42 | | Monthly Target 5 | 213.53 |
Monthly price and volumes Shbajrg
| Date |
Closing |
Open |
Range |
Volume |
Thu 23 October 2025 |
197.30 (-1.57%) |
204.45 |
188.05 - 204.85 |
0.4417 times |
Tue 30 September 2025 |
200.45 (0.22%) |
200.00 |
192.00 - 227.40 |
0.9805 times |
Fri 29 August 2025 |
200.00 (2.62%) |
199.90 |
191.05 - 206.45 |
0.392 times |
Thu 31 July 2025 |
194.90 (-13.32%) |
225.05 |
190.05 - 226.00 |
0.4535 times |
Mon 30 June 2025 |
224.85 (11.09%) |
195.35 |
190.00 - 249.50 |
1.9851 times |
Fri 30 May 2025 |
202.40 (21.53%) |
166.40 |
151.00 - 225.00 |
1.6508 times |
Wed 30 April 2025 |
166.55 (24.34%) |
144.70 |
141.00 - 179.85 |
0.8118 times |
Fri 28 March 2025 |
133.95 (-17.7%) |
166.90 |
133.15 - 166.90 |
1.8397 times |
Fri 28 February 2025 |
162.75 (-15.41%) |
198.60 |
158.00 - 198.60 |
0.5659 times |
Fri 31 January 2025 |
192.40 (-9.82%) |
216.00 |
183.10 - 234.00 |
0.8789 times |
Tue 31 December 2024 |
213.35 (7.13%) |
204.45 |
196.70 - 250.35 |
1.1389 times |
DMA SMA EMA moving averages of Shbajrg 526981
DMA (daily moving average) of Shbajrg 526981
| DMA period | DMA value | | 5 day DMA | 194.27 | | 12 day DMA | 194.98 | | 20 day DMA | 196.98 | | 35 day DMA | 198.84 | | 50 day DMA | 198.71 | | 100 day DMA | 205.58 | | 150 day DMA | 191.68 | | 200 day DMA | 191.48 | EMA (exponential moving average) of Shbajrg 526981
| EMA period | EMA current | EMA prev | EMA prev2 | | 5 day EMA | 195.71 | 194.91 | 192.77 | | 12 day EMA | 195.68 | 195.39 | 194.7 | | 20 day EMA | 196.51 | 196.43 | 196.14 | | 35 day EMA | 197.25 | 197.25 | 197.14 | | 50 day EMA | 198.12 | 198.15 | 198.11 |
SMA (simple moving average) of Shbajrg 526981
| SMA period | SMA current | SMA prev | SMA prev2 | | 5 day SMA | 194.27 | 193.24 | 192 | | 12 day SMA | 194.98 | 195.2 | 195.12 | | 20 day SMA | 196.98 | 197.46 | 197.9 | | 35 day SMA | 198.84 | 198.92 | 198.77 | | 50 day SMA | 198.71 | 198.73 | 198.76 | | 100 day SMA | 205.58 | 205.7 | 205.76 | | 150 day SMA | 191.68 | 191.4 | 191.06 | | 200 day SMA | 191.48 | 191.56 | 191.62 |
|
|
